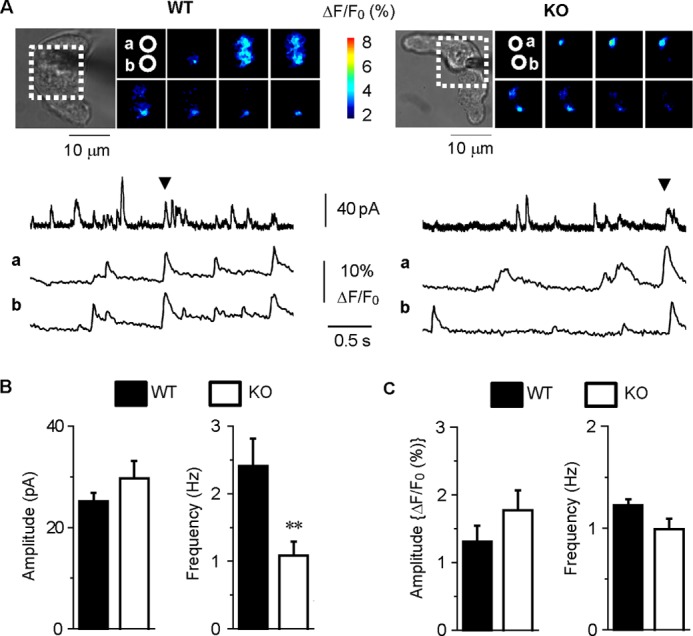
FIGURE 6.

Simultaneous recordings of STOCs and Ca2+ sparks in WT and KO myocytes. A, fluorescent images surrounded by a dotted line in the transmitted light images (upper) were collected at the time points indicated by arrowheads in the membrane current recordings (middle). The fluorescent images were also shown in supplemental Movies 3 and 4. Changes in cytosolic Ca2+ levels at the two sites (a and b) circled in the fluorescent images are correspondingly shown (lower). B, the mean STOC amplitude and frequency in WT (n = 5) and KO (n = 10) cells are summarized (**, p < 0.01, versus WT). C, the mean Ca2+ spark amplitude and frequency in WT (n = 5) and KO (n = 10) cells are summarized (p > 0.05).
