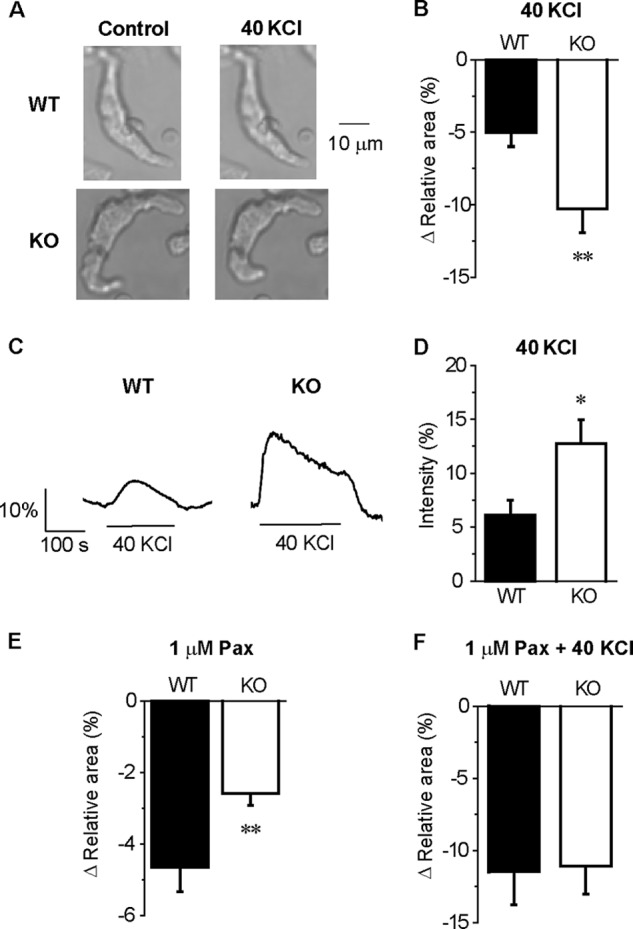
FIGURE 7.

BKCa activity is lower in KO than in WT myocytes. A, images of single cell contraction caused by 40 KCl. B, summarized data of the 40 KCl-induced decrease in cell area in the images relative to that before 40 KCl application in WT (n = 21) and KO (n = 19) myocytes, respectively. C, change in the intracellular Ca2+ level caused by 40 KCl. D, summarized data of 40 KCl induced Ca2+ elevation in the WT (n = 8) and KO (n = 9) myocytes. E and F, summarized data of a 1 μm Pax-induced (E) and 1 μm Pax + 40 KCl-induced (F) decrease in cell area in WT (n = 12) and KO (n = 20) myocytes. *, p < 0.05; **, p < 0.01 versus WT.
