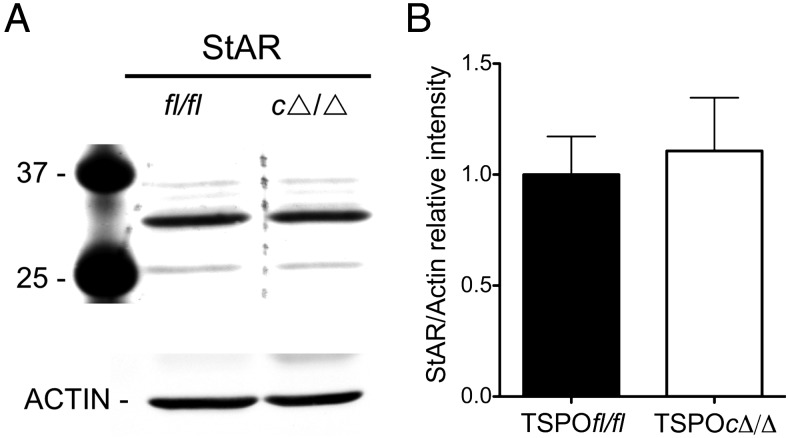
Figure 5.
StAR expression is unchanged in TSPOcΔ/Δ testis. A, Representative Western blot showing no change in testicular StAR protein in TSPOcΔ/Δ compared with TSPOfl/fl mice; β-actin is shown as the loading control. B, Relative intensity of testicular StAR protein expression (ratios of StAR/β-actin band intensities) between TSPOfl/fl and TSPOcΔ/Δ mice was not significantly different (n = 3/group).

