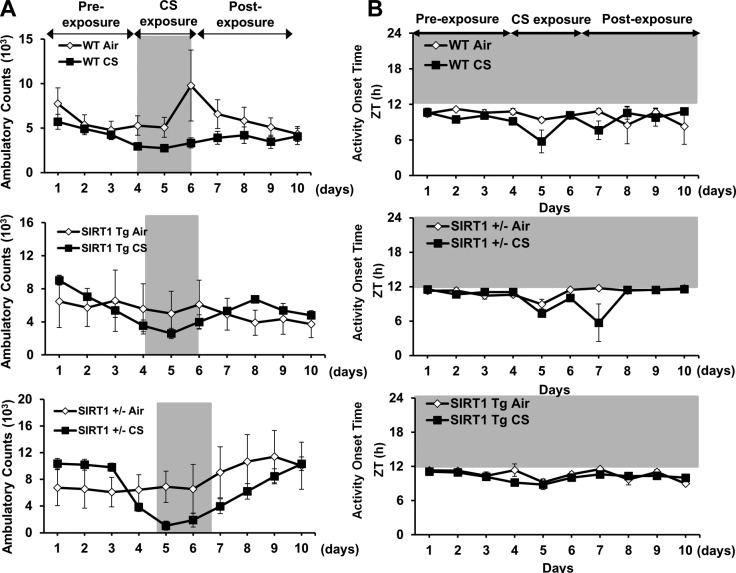
Figure 10.
Ambulatory counts (A) and activity onset time (ZT) by acute CS exposure (B) in WT, heterozygous SIRT1-knockout (SIRT+/−), and SIRT1-overexpressing (SIRT1 Tg) mice. Activity onset relative to lights off (ZT12; phase angle of entrainment) during the period of preexposure (d 1–3), CS exposure (d 4–6), and postexposure (d 7–10). Gray shading indicates the dark phase (ZT12-24). Data from air- and CS-exposed mice represent means ± se (n=3–4 mice/group) for each time point.

