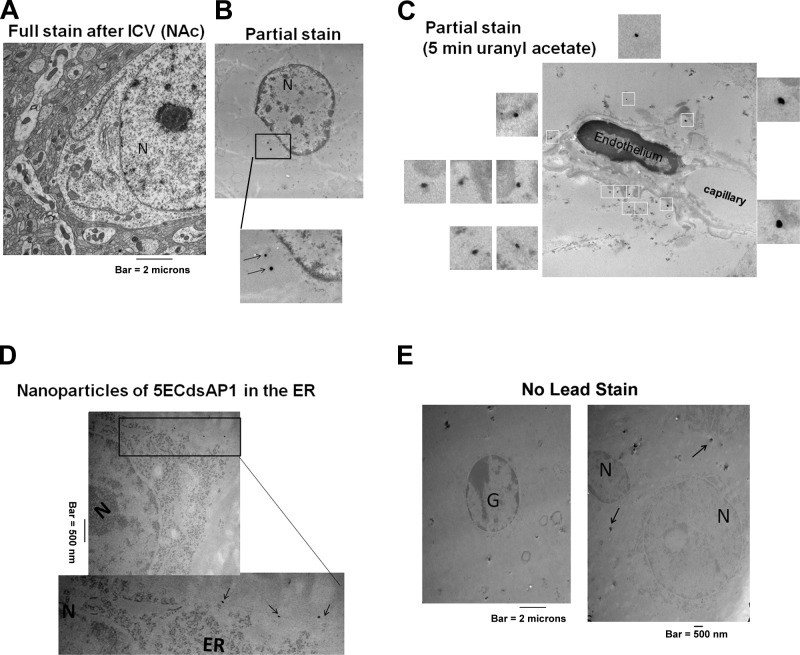
Figure 3.
Subcellular distribution of aptamers: SPION-5ECdsAP1 or AU-5ECdsAP1 was delivered at a dose of 40 μg Fe/kg (A–C) or 40 μg Au/kg (D–E), i.c.v. injection). We administered amphetamine (n=2 each) as described in Materials and Methods; at 4 h after delivery, we obtained brain samples from the NAc and, in preparation for TEM, fixed the tissue for full staining (A) as well as for staining without osmium and uranyl acetate (B–D) and lead (E), as described in Materials and Methods. Arrows in panels B and D show that several EDNs were identified in the ER, at the site of protein translation. Arrows in panels D and E show that EDNs are not artifacts related to the lead stain. G, glia; N, neuronal nucleus based on diameters.

