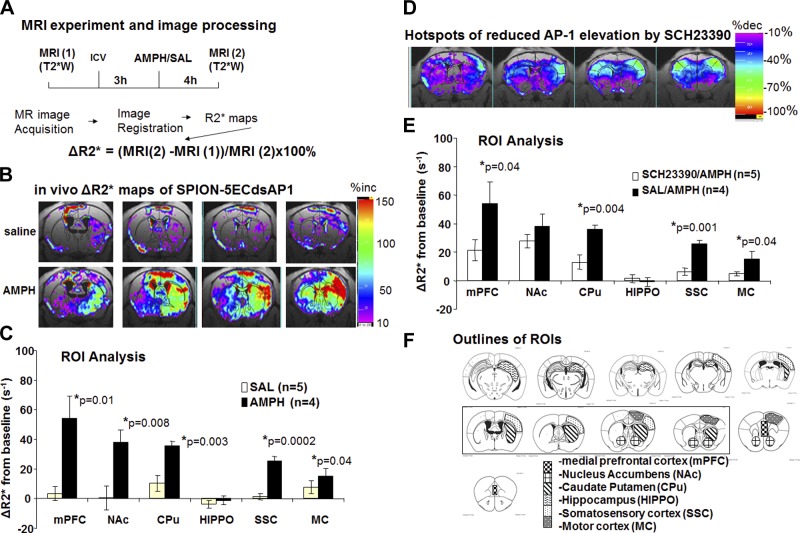
Figure 4.
Target-guided MRI with SPION-5ECdsAP1 (40 μg Fe/kg or 120 pmol dsAP1/kg, i.c.v. injection). A) MRI acquisition protocol and data processing methods. B) Increase in MR signal intensity in subtraction R2* maps. C–E) Frequency of the drop in MRI signal (R2* or 1/T2* ms × 1000) is shown as percentage increase in ΔR2* maps in 3 groups of mice: saline (SAL) vs. amphetamine (AMPH) (C), or SCH23390 vs. AMPH (D, E). Bar graphs show means ± sem (t test, vs. SAL controls) for SPION retention in various ROIs in live brains following SPION-5ECdsAP1. F) Anatomic ROIs from which we obtained MRI data.

