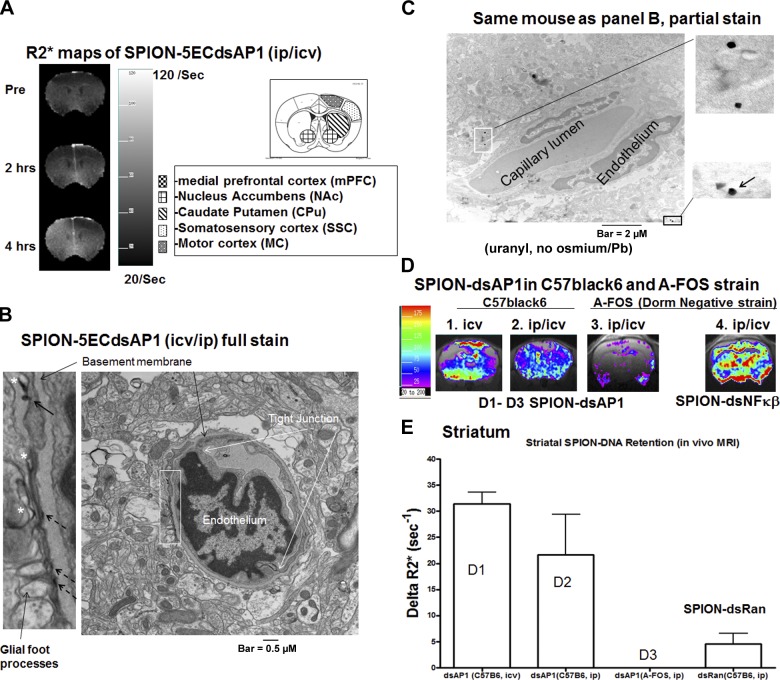
Figure 6.
Binding specificity of SPION-5ECdsAP1 (4 mg Fe/kg or 12 nmol dsAP1/kg, i.p./i.c.v. injection). A) Homogenously elevated R2* values measured before (Pre), as well as 2 and 4 h after delivery of SPION-5ECdsAP1. B, C) EDNs were detected in the perivascular space by TEM under full stain (B) as well as under partial stain (C). Solid arrow in panel B (left image) indicates an EDN transporting across the membrane; broken arrows indicate naked EDNs; asterisks indicate EDNs enclosed by membrane. Arrow in panel C inset indicates END from artifacts. D) Representative aptamer uptake for SPION-5ECdsAP1 in C57black6 mice (n=2 each; panels 1 and 2) or SPION-5ECdsAP1 or SPION-5ECdsNF-kb in double-transgenic A-FOS mutant mice (n=3; panels 3 and 4) is shown as ΔR2* maps; increase is calculated according to the result shown in Fig. 5A. E) Signal increase of SPION-5ECdsAP1 in the striatum, shown in panel D; this ROI is defined in panel A. Difference in striatal ΔR2* of panel D3 and SPION-5ECdsRan above the baseline was not significant.

