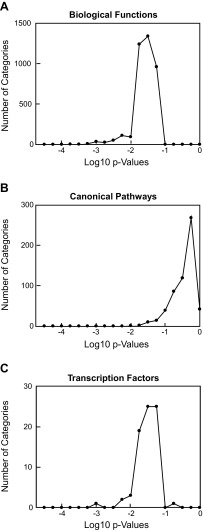
Figure 2.
IPA of RKO microarray data. Genes numbering 298 that were identified in IPA and differed in mean expression level by ≥1.5-fold between the control and RKO groups were subjected to Ingenuity Pathway Analysis. Graphs show the distribution of P values for 5 control gene sets for each analysis, each of which were equal in number to the experimental gene set. A) Biological functions. B) Canonical pathways. C) Transcription factors. Tables 1–3 show IPA categories and corresponding P values for each analysis.

