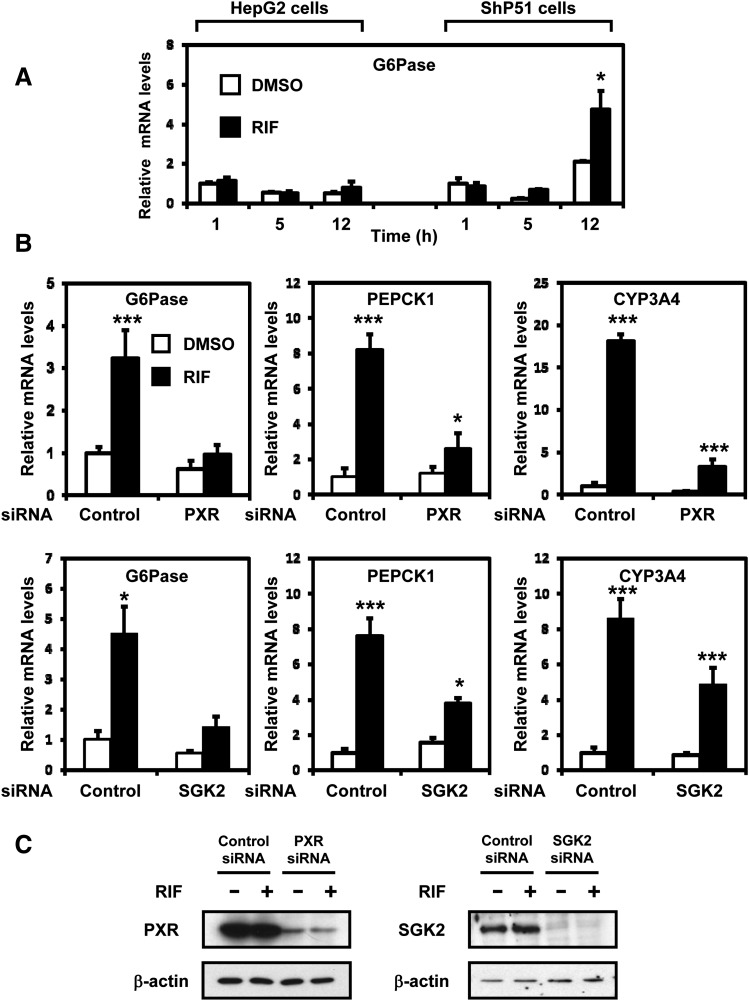
Fig. 3.
PXR is required for SGK2 in rifampicin induction of G6Pase and PEPCK1. (A) HepG2 cells and ShP51 cells were treated with rifampicin (RIF, 100 μM) or DMSO (control) for 1, 5, and 12 hours (n = 3). The relative expression of G6Pase mRNA was measured by qRT-PCR and was normalized to endogenous glyceraldehyde-3-phosphate dehydrogenase using the comparative cycle threshold method. Values are scored as a fold-change relative to 1-hour DMSO-treated cells. (B) ShP51 cells were transfected with PXR siRNA, SGK2 siRNA, or control siRNA, followed by treatment with rifampicin (RIF, 100 μM) or DMSO (control) for 3 hours (n = 3). The relative expression of G6Pase, PEPCK1, and CYP3A4 mRNAs was measured by qRT-PCR and was normalized to endogenous glyceraldehyde-3-phosphate dehydrogenase using the comparative cycle threshold method. Values are scored as a fold-change relative to DMSO control siRNA. (C) The knockdown efficiencies of PXR and SGK2 were confirmed by Western blot using anti-PXR antibody and anti-SGK2 antibody. Statistical analysis was assessed by one-way ANOVA; *P < 0.05; ***P < 0.001.

