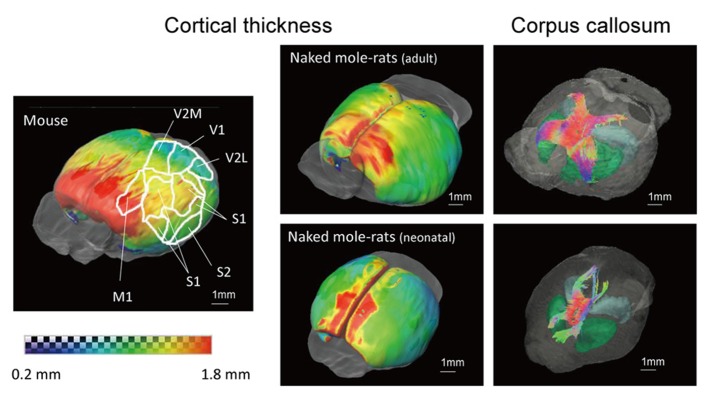
FIGURE 6.
3D surface maps showing cortical thickness and images of corpus callosum of the adult (above right) and neonatal (below right) naked mole-rats brain, and the mouse brain that maps major sensory systems (left). Thickness is indicated by color as follows: (dark blue, 0.2 mm to red, 1.8 mm). Whole brain images with the corpus callosum are shown to the right. Colors reveal the directions of the tracts (red, right–left; green, cranial–caudal; blue, ventral–dorsal). M1, primary motor cortex; S1, primary somatosensory cortex; S2, secondary somatosensory cortex; V1, primary visual cortex; V2M, secondary visual cortex medial area; V2L, secondary visual cortex lateral area. Scale bar = 1 mm.

