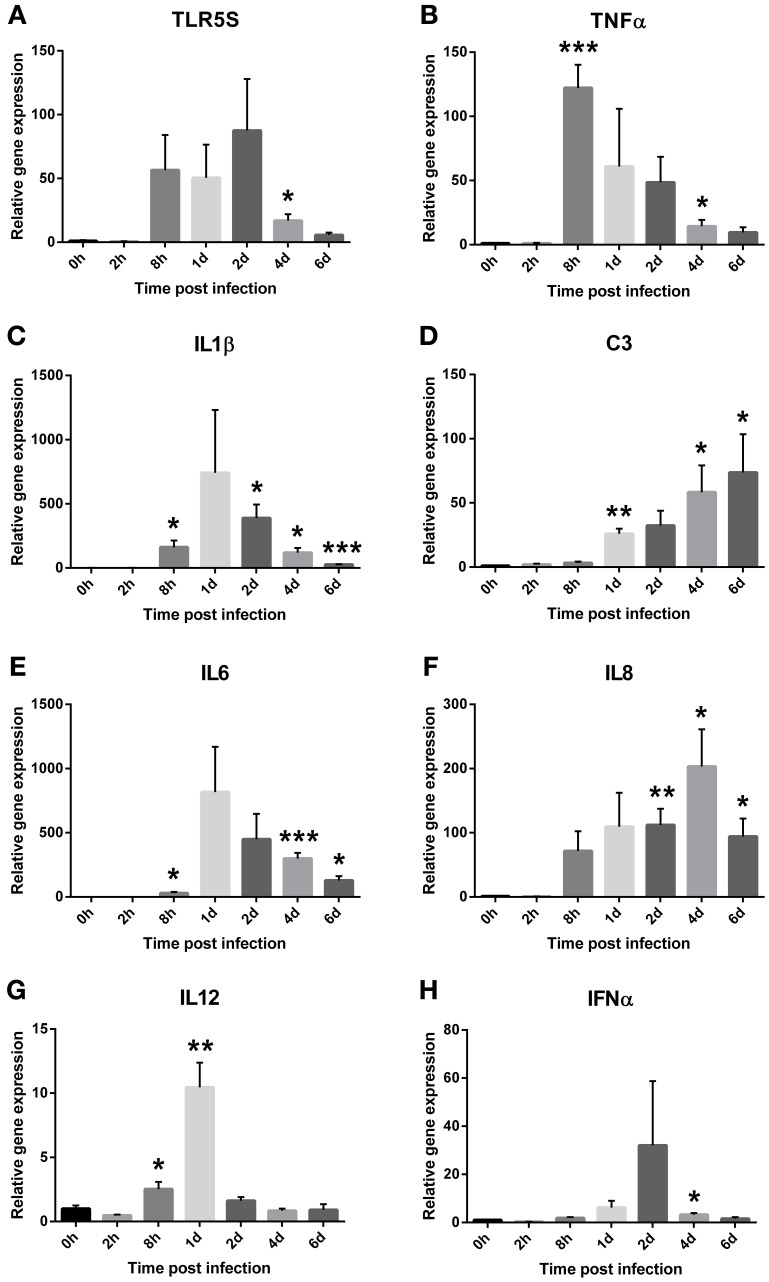
Figure 3.
Relative expression levels of the salmon immune parameters (A) TLR5S, (B) TNFα, (C) IL1β, (D) IL6, (E) IL8, (F) C3, (G) IL12, and (H) IFNα in the spleen during an experimental V. salmonicida i.p.-infection. Each time point represents the average expression level of four fish and is reported as fold change ± standard error of the mean (s.e.m.) compared to the average expression levels of four control fish sampled before challenge. *p < 0.05, **p < 0.005, ***p < 0.0005.

