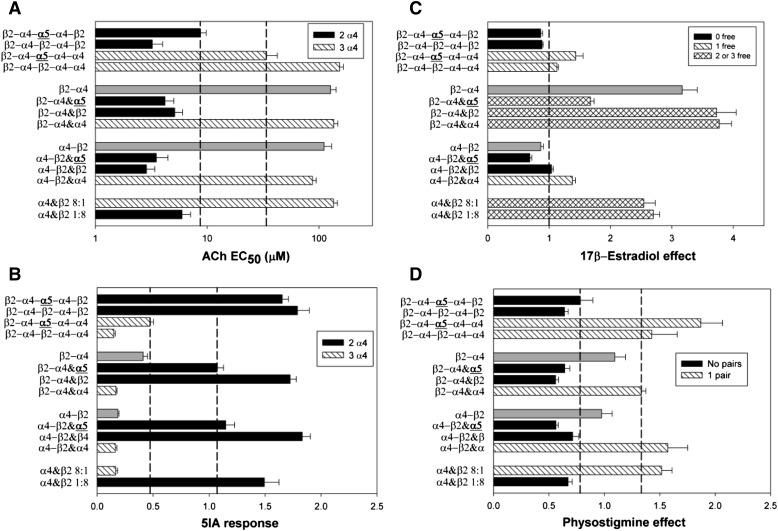
Fig. 2.
Graphical depiction of the pharmacological profiles. (A and B) Responses to agonists [(A) ACh EC50 (note logarithmic abscissa); (B) response to 1 μM 5I A85380 relative to 1 mM ACh], while C and D show the effects of two modulating drugs [(C) effect of 10 μM 17β-estradiol; (D) 10 μM physostigmine]. The panels are formatted in the same way: at the bottom are free subunits at two different cRNA ratios, then a group of four receptors containing the α4-β2 concatemer, four receptors containing the β2-α4 concatemer, and four pentamers. The position of the α5 subunit is emphasized in bold and underlined. The bars are filled to indicate predicted structural features. In each panel, the bars corresponding to dimers expressed without a free subunit are filled with gray. In A and B, the solid fill indicates receptor predicted to have two copies of α4 and diagonal hatching indicates three copies of α4. In C, solid fill indicates no free (untethered) α4 C termini, diagonal hatching one free C terminus, and cross-hatching two or three free C termini. In D, solid fill indicates no adjacent α4 subunits, while diagonal hatching indicates a pair of adjacent α4 subunits. The bars in the panels show mean values ± S.E. Data values are presented in Table 1.

