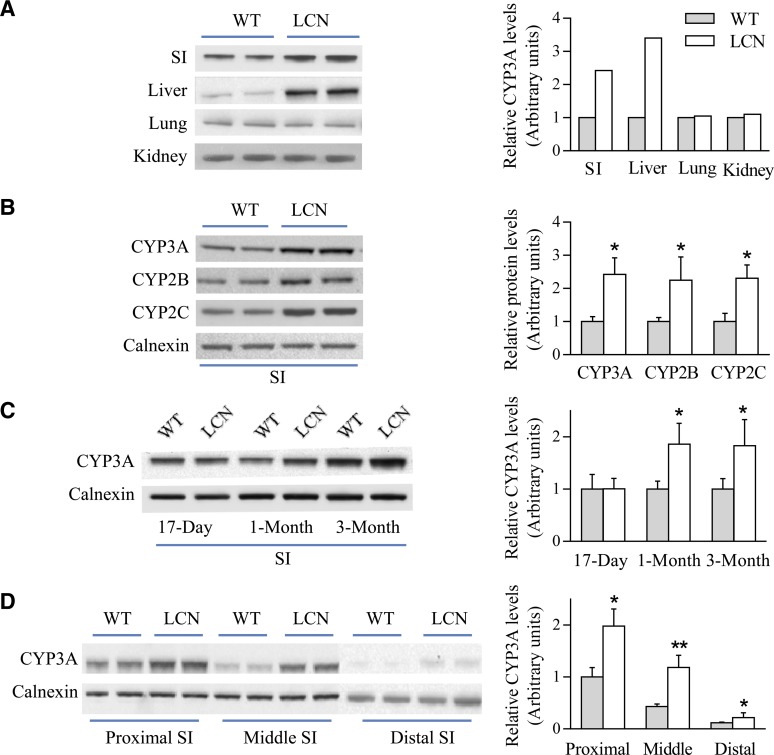
Fig. 1.
Immunoblot analysis of P450 expression in WT and LCN mice. (A) Microsomal proteins from SI (20 μg), liver (10 μg), lung (10 μg), and kidney (10 μg) of adult male mice were analyzed in duplicate for CYP3A expression. (B) SI microsomal proteins (10 μg) of adult male mice were analyzed in duplicate on immunoblots for the expression of CYP3A, 2B, and 2C, as well as calnexin (as a loading control). (C) SI microsomal proteins (20 μg) from mice at 17 days, 1 month, or 3 months of age were analyzed for CYP3A expression. (D) Microsomal proteins (20 μg) from different SI segments of adult male mice were analyzed in duplicate for CYP3A expression. Each microsomal sample was prepared from tissues pooled from two to three mice. Results of densitometric analysis (bar graphs) are normalized by calnexin levels in each sample and are shown in arbitrary units. Typical results are shown. *P < 0.05; **P < 0.01; compared with WT mice (Student’s t test).

