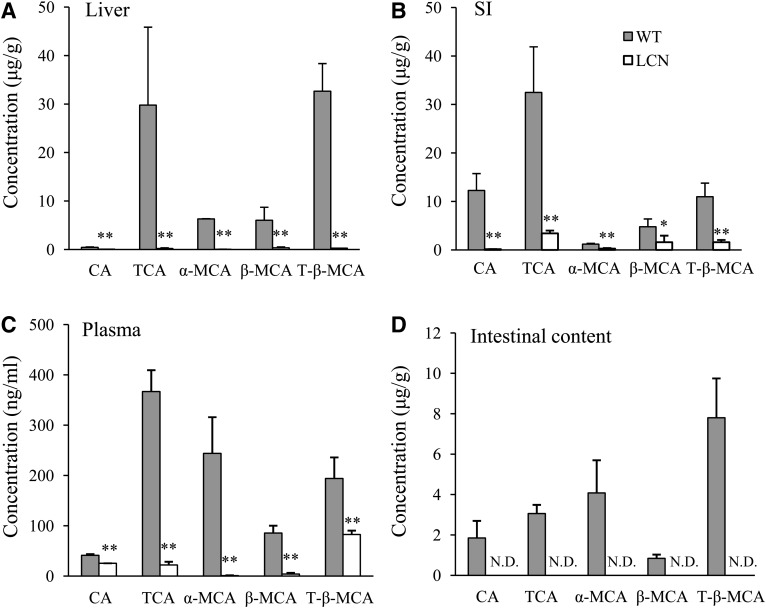
Fig. 4.
BA levels in liver (A), SI epithelium (B), plasma (C), and intestinal content (D) of adult male WT and LCN mice. Five different BAs were determined using LC-MS/MS as described in Materials and Methods. Results are shown as means ± S.D. (n = 6). *P < 0.05; **P < 0.01, compared with WT mice (Student’s t test). N.D., not detected.

