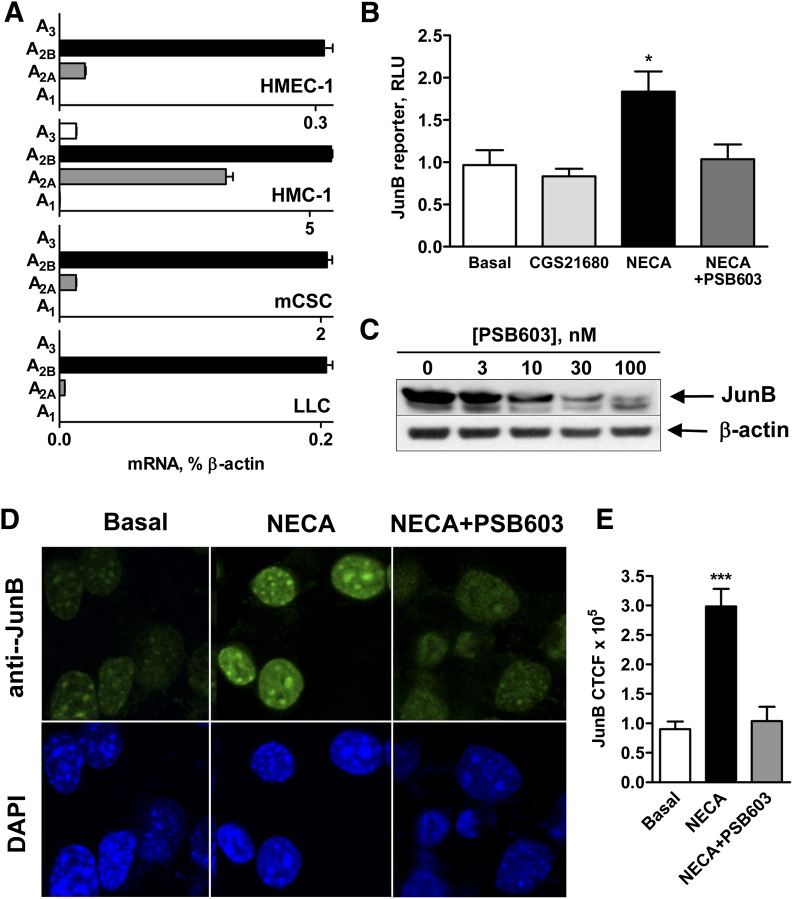
Fig. 3.
A2B adenosine receptors mediate an increase in JunB promoter-driven reporter activity and JunB protein accumulation in the nucleus. (A) Real-time reverse-transcription polymerase chain reaction analysis of mRNA encoding adenosine receptor subtypes in HMEC-1 cells, HMC-1 cells, mCSC cells, and LLC cells was performed as described in Materials and Methods. Values are expressed as average of two determinations made in triplicate. (B) Pharmacologic analysis of the role of A2 adenosine receptor subtypes in regulation of JunB promoter-driven reporter activity in LLC cells. LLC cells were transiently transfected with JunB promoter-driven luciferase reporter and then incubated in the absence (basal) or presence of the selective A2A receptor agonist CGS 21680 (1 μM), or the nonselective adenosine receptor agonist NECA (10 μM) in the absence or presence of the selective A2B receptor antagonist PSB603 (100 nM) for 3 hours. Values are presented as mean ± S.E.M. (n = 3). An asterisk indicates the statistical difference (*P < 0.05) compared with basal levels. (C) Effect of increasing concentrations of the selective A2B receptor antagonist PSB603 on JunB protein levels in LLC cells stimulated with 10 μM NECA for 3 hours. A representative blot of three experiments is shown. (D) Pharmacologic analysis of the role of A2B adenosine receptors in regulation of JunB protein accumulation in LLC nuclei. LLC cells were incubated in the absence (basal) or presence of the nonselective adenosine receptor agonist NECA (10 μM) in the absence or presence of the selective A2B receptor antagonist PSB603 (100 nM) for 3 hours. Representative micrographs are shown of anti-JunB–stained LLC cells (green) and nuclei stained with 4′,6-diamidino-2-phenylindole (DAPI; blue) from three experiments. (E) Quantification of the immunofluorescence data shown in D. Fluorescence intensity was measured in seven randomly chosen cells per slide using ImageJ, and the corrected total cell fluorescence (CTCF) values are presented as mean ± S.E.M. Asterisks indicate statistical difference (***P < 0.001) compared with basal levels.

