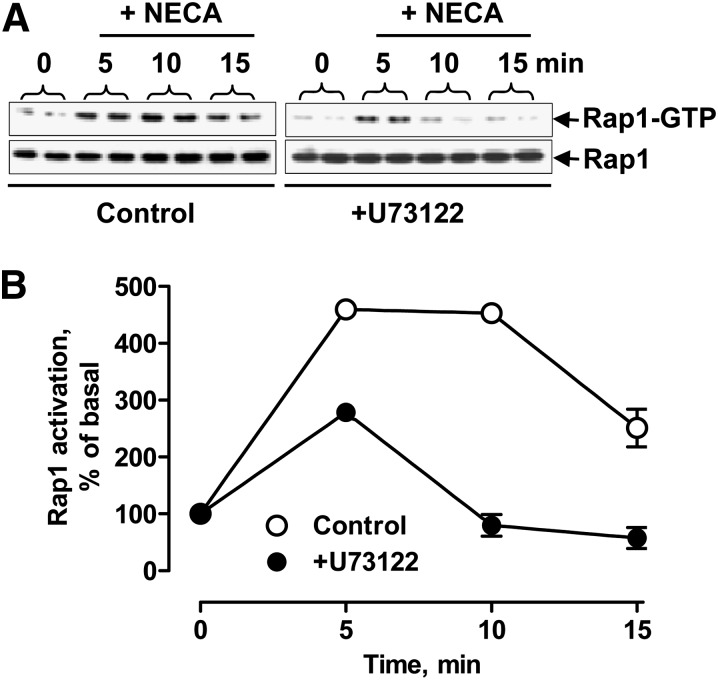
Fig. 7.
Effect of PLC inhibition on adenosine-dependent Rap1 activation. (A) Western blot analysis of active GTP-bound form of Rap1 obtained by glutathione S-transferase-Ral-GDS pull-down before and 5, 10, and 15 minutes after stimulation of HMEC-1 cells with 10 μM NECA in the absence (control) and presence of 10 μM U73122. Total Rap1 protein levels in corresponding cell lysate aliquots are shown in the bottom panels. Representative blots of three experiments are shown. (B) Graphic representation of data shown in A quantified by densitometry and expressed as a percentage of the corresponding levels in resting cells normalized to total Rap-1 protein levels used as internal control.

