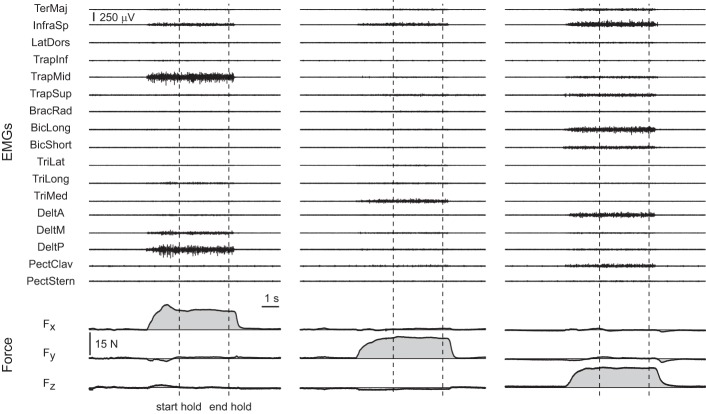
Figure 2.
Examples of raw EMG and force data. Data were recorded during three trials of subject 8 with targets at 20% MVF along the positive Fx axis (first column, target 16 in Figure 1), the positive Fy axis (second column, target 18 in Figure 1), and the positive Fz axis (third column, target 32 in Figure 1). The vertical dashed lines indicate the beginning and the end of the hold phase.

