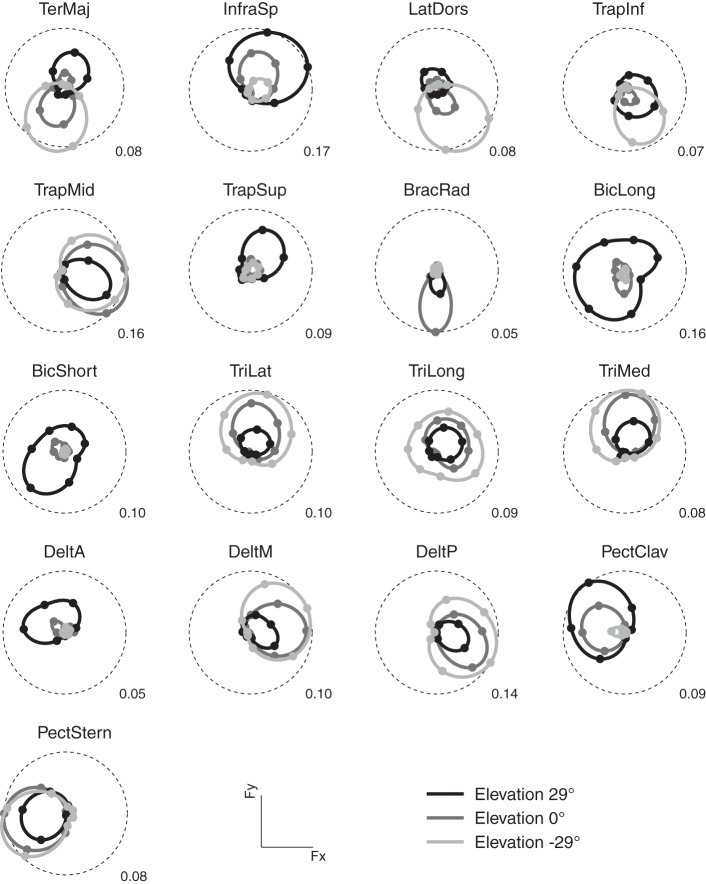
Figure 3.
Example of directional tuning of muscle activations. Polar plots representing the average EMG activity (hold phase, normalized to MVC) for targets on three horizontal planes at different elevations (light gray: −29°, targets 6–12, medium gray: 0°, targets 13–20, dark gray: 29°, targets 21–27) recorded in subject 8. Numerical value at the bottom right of each plot represents the fraction of mean MVC across all directions for each muscle and corresponds to the radius of the dashed circle. The direction of each marker represents the direction of the horizontal force components, its radius the average EMG activity when holding the target in that direction. Markers are interpolated by splines in polar coordinates.

