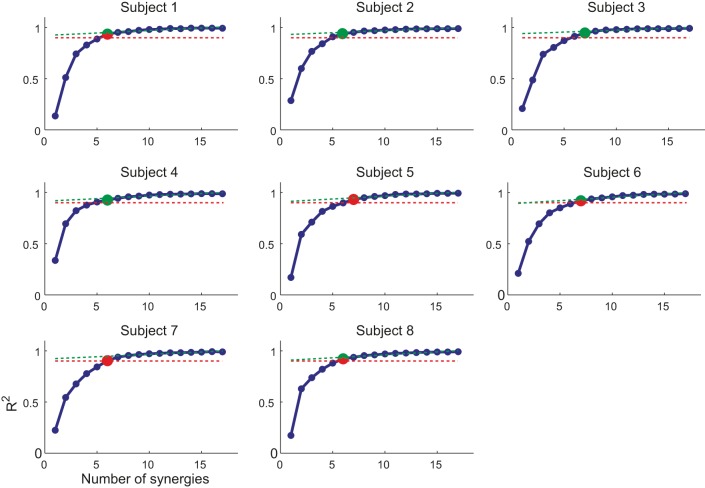
Figure 4.
Selection of number of synergies. The number of synergies (N) is chosen for each subject as (i) the smallest N for which the R2 value (blue markers and line) was larger than 0.9 (red dashed line) or (ii) the point at which the R2 vs. N curve had a change in slope [MSE of linear fit from N to max(N) below 10−4, green dashed line]. In case of mismatch between the two criteria, the set of synergies with smallest number of similar preferred directions was selected (red/green marker, smallest number of synergy pairs with an angular difference between preferred direction below 20°).

