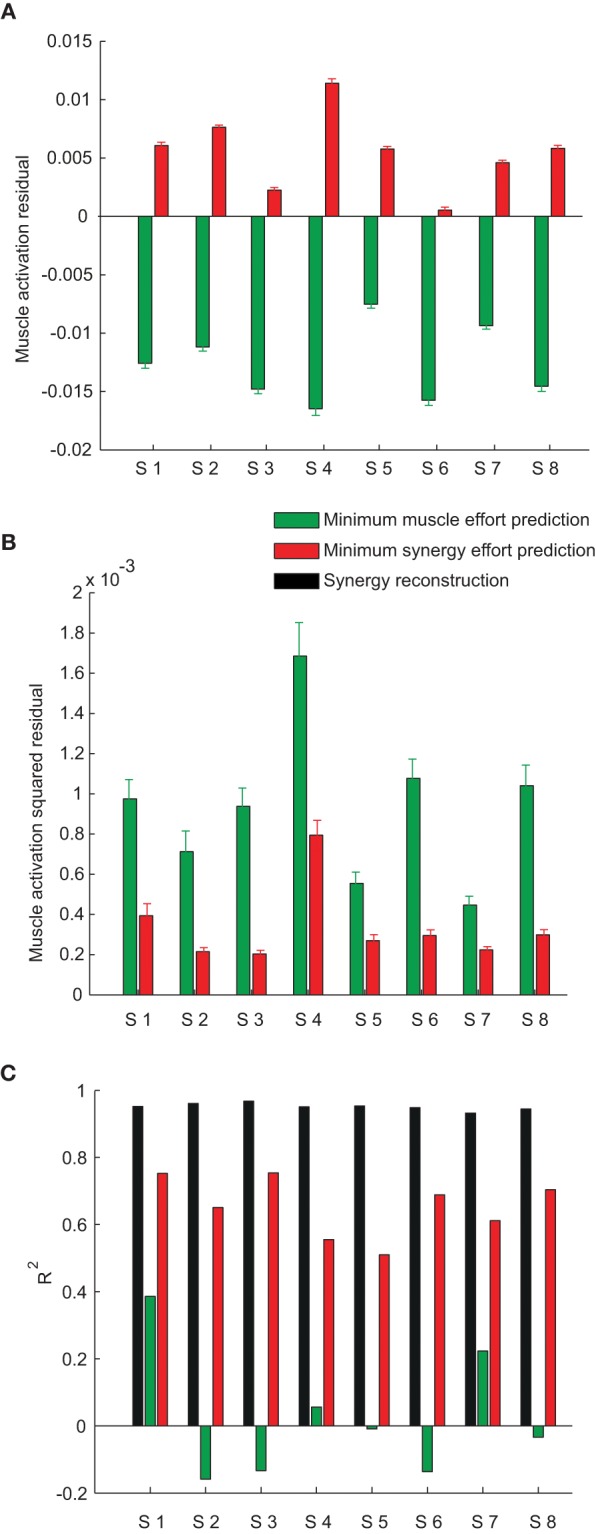
Figure 8.

Model prediction error. (A) Mean ± SE of the residual, over muscles and force targets, of the minimum muscle effort prediction (green bars) and the minimum synergy effort prediction (red bars) for all subjects. (B) Mean ± SE of the squared residual, over muscles and force targets, of the minimum muscle effort prediction (green bars) and the minimum synergy effort prediction (red bars) for all subjects. (C) Comparison of the R2 values for the synergy reconstruction (black bars) and the model predictions.
