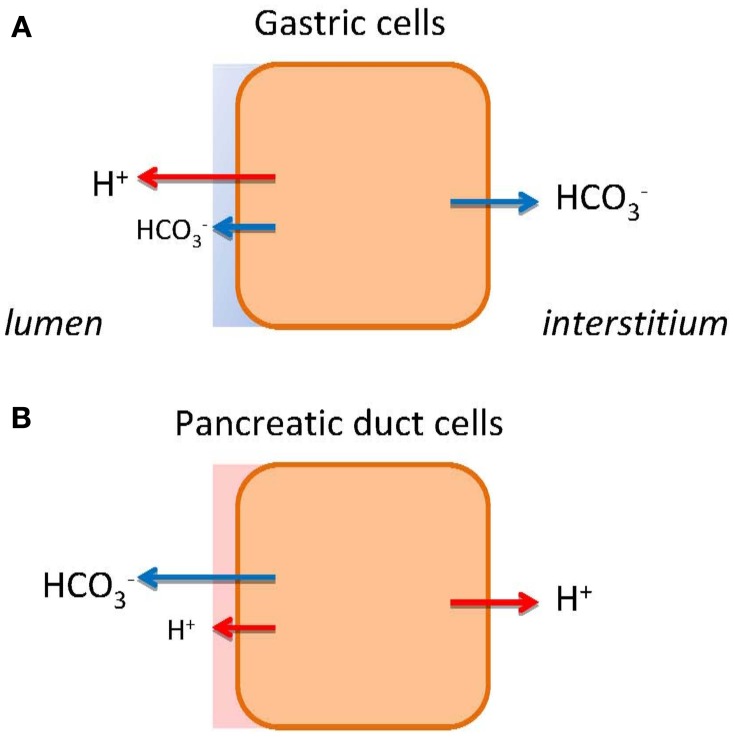
Figure 1.
HCO−3 and H+ transport in gastric cells (A) and pancreatic duct cells (B). The models show schematically different types of epithelia as single cells. The transport of H+ or HCO−3 to the bulk luminal fluid is shown with large arrows. The small arrows on luminal side indicate HCO−3 and H+ secretions to the mucosal buffer zone. Flux of HCO−3 and H+ to the interstititum/blood side indicates expected alkaline or acid tides.

