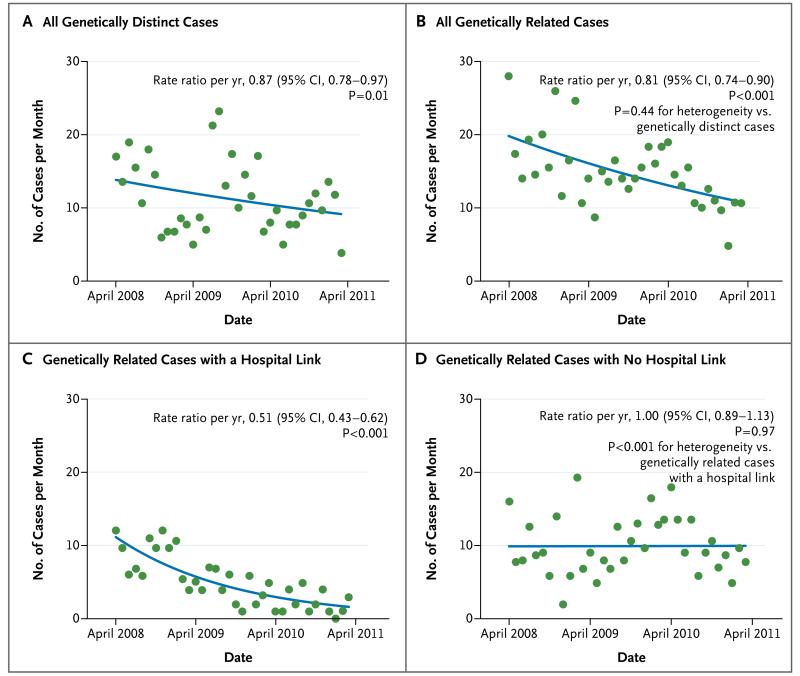
Figure 4. Trends in Genetically Related and Distinct Cases, According to Date.
Shown are cases of C. difficile infection that were genetically distinct (>10 SNVs) from all previous cases (on the basis of samples obtained after September 1, 2007) (Panel A), cases that were genetically related (≤2 SNVs) (Panel B), and cases that were genetically related and either had a hospital link (Panel C) or had no hospital link (Panel D). The study population was 600,000 persons, so the rate of 30 cases per month corresponds to 5 cases per 100,000 population per month. The blue lines indicate the model-based estimates of the per-year rate ratio. (Details regarding the regression models that were used in the analysis and trends in genetically related cases grouped according to the presence or absence of ribotype 027 are provided in the Supplementary Appendix.)

