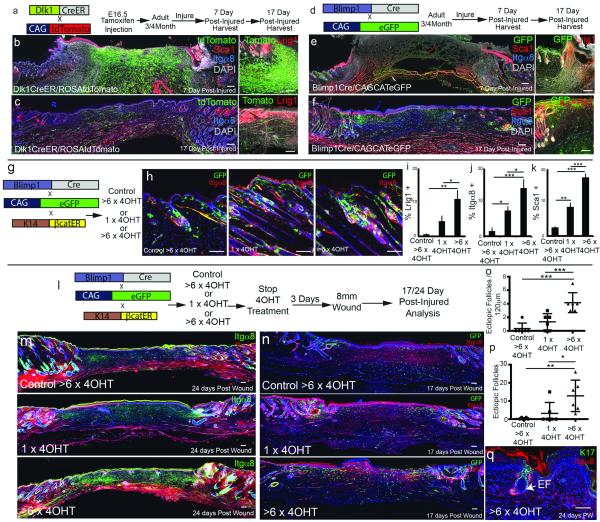
Figure 4. Contribution of fibroblast lineages in adult skin.
(a, d, g, l) Labelling strategies. (b, c, e, f, h, m, n, q) Histological analysis of horizontal whole mounts. (i-k) Flow cytometric quantification of fibroblast markers. (o, p) Quantitation of ectopic hair follicles in (o) 17 day wound bed whole mount sections and (p) entire 24 day wound bed. (i-k) n = 3, (o, p) n = 6 biological replicates. *P <0.05, **P <0.005, ***P <0.0005. Scale bars: 200μm (b, c, e, f), 100μm (m, n, q) or 50μm (higher magnification views).

