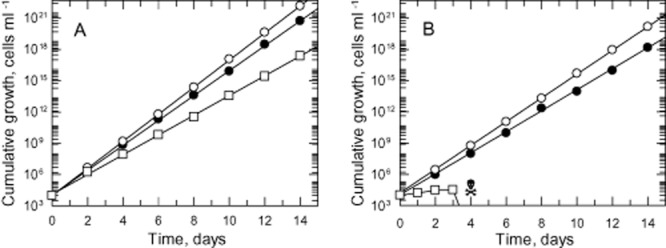
Figure 3.

Growth analyses of WT and DKO cells in vitro. The cumulative growth curves after normalization for dilution at each subculture of WT (A) and DKO (B) cells were determined over two weeks in HMI9T (open circles), TBMFCS (closed circles) and TBMdFCS (open squares).
