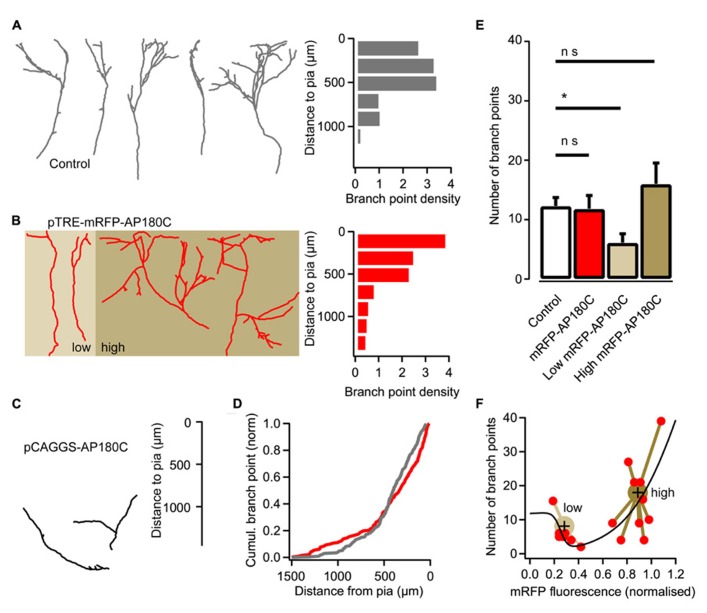
FIGURE 3.
Reducing clathrin-mediated endocytosis with AP180C affects axon branching. (A) Reconstructions of representative axons from thalamic cells in the neocortical explant and a histogram showing the distribution of axonal branch points with respect to the pial surface. Control axons exposed to doxycycline for two days. Branch-point density = number of branch points/number of axons. (B) Reconstructions of representative axons from thalamic cells where the expression of mRFP-AP180C was induced with doxycycline two days earlier. A histogram showing the distribution of axonal branch points with respect to the pial surface is shown on the right. Axons expressing low amount of mRFP-AP180C are against a light brown background. Axons expressing high amount of the construct are against a dark brown background. (C) Reconstructions of representative axons from thalamic cells expressing mRFP-AP180C for 13 days. (D) Cumulative plot of the branch-point location with respect to the pial surface for doxycycline-induced mRFP-AP180C-expressing axons (red) and controls (gray). (E) Average number of branch points for doxycycline-exposed controls and induced mRFP-AP180C-expressing cells. When mRFP-AP180C-expressing cells were divided into two groups according to a k-means clustering algorithm (see panel F), the group with low mRFP-AP180C fluorescence had fewer branch points than the controls. The error bars represent SEM. *P < 0.05 (ANOVA). (F) Number of branch points plotted against mRFP-AP180C fluorescence intensity. The black line illustrates opposing effects on branch number from two AP180C-mediated mechanisms using the sum of two sigmoid functions with opposite signs and parameters fit using least sum of squares. Large markers are centroids from a k-means clustering analysis with the relevant data points connected with lines.

