FIGURE 4.
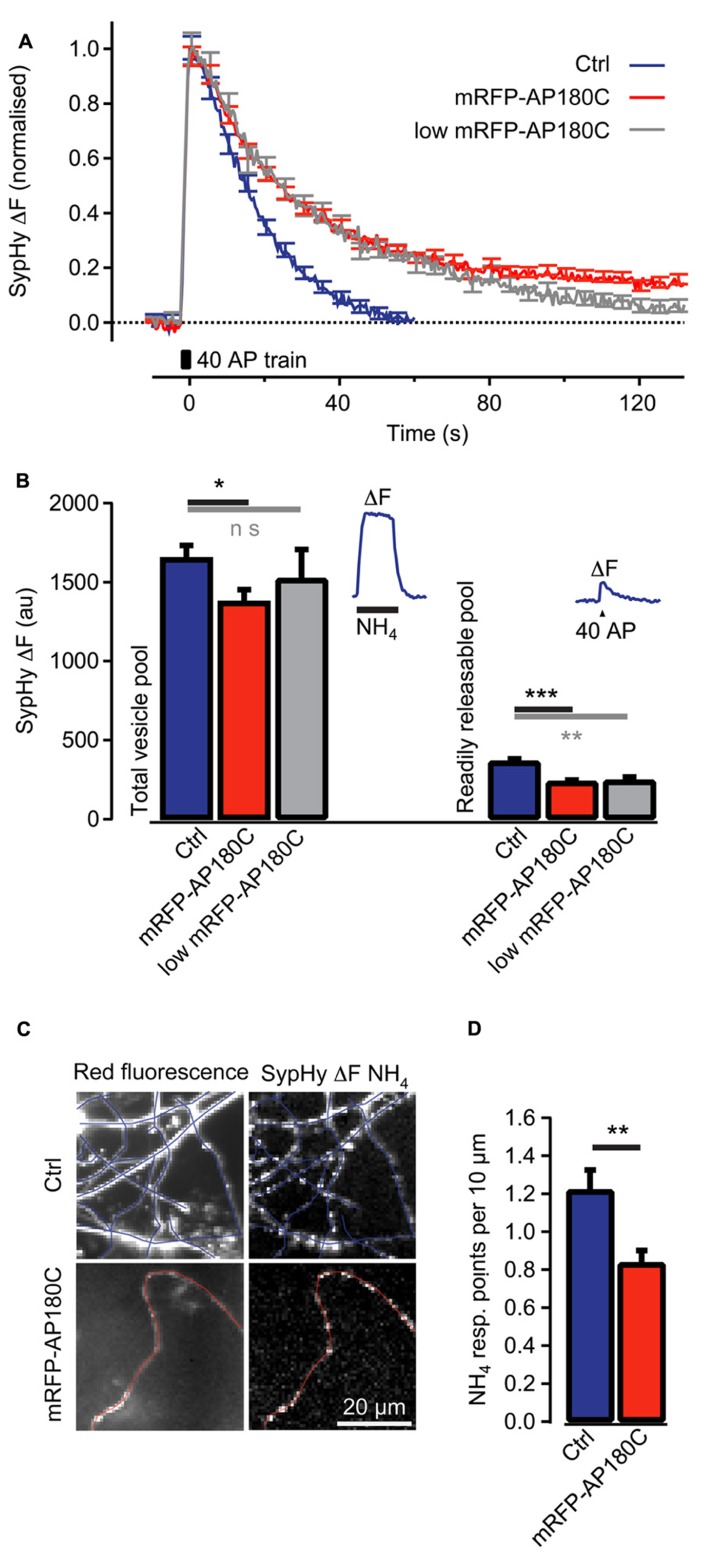
Clathrin-mediated endocytosis of synaptic vesicle membrane is reduced in synapses even when mRFP-AP180C content is low. (A) Change in SypHy fluorescence intensity (normalized to the peak) after 40 action potentials at 20 Hz (40 AP train). During the action potential train, the fluorescence intensity increased from exocytosis of synaptic vesicles when SypHy in the acidic lumen of vesicles was exposed to the neutral pH of the extracellular space. After termination of the action potential train, the fluorescence returned to baseline when SypHy was endocytosed with the vesicle membrane and the vesicle lumen re-acidified. The blue trace indicates control synapses with no detectable mRFP-AP180C fluorescence. The red line indicates entire population of synapses containing mRFP-AP180C. The gray trace indicates the 20% of synapses with the least intense mRFP-AP180C fluorescence. (B) Total vesicle pool estimated through the fluorescence change from collapsing the pH of all synaptic vesicles using an NH4-containing buffer at pH 7.4. Readily releasable pool estimated from the fluorescence change after 40 action potentials at 20 Hz. The error bars represent SEM. *P < 0.05, **P < 0.01, ***P < 0.001. The inset shows the average response for control synapses in one culture to illustrate the protocol. (C) Micrographs of red fluorescence in control axons (Ctrl) expressing mRFP and axons expressing mRFP-AP180C and the increase in green fluorescence (ΔF) from SypHy, induced by NH4-containing buffer. Blue and red lines are tracings along the axons. (D) Average number of points per 10 μm of axon that responds to NH4-containing buffer. These points where SypHy containing vesicles are accumulated are the locations of putative synapses. The error bars represent SEM. *P < 0.05, **P < 0.01, ***P < 0.001.

