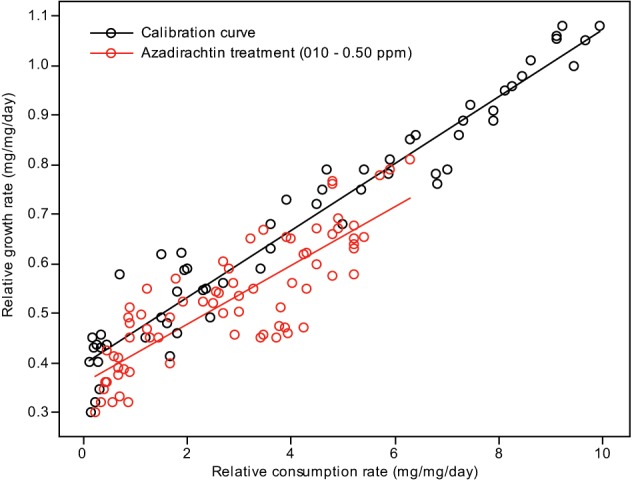
Figure 3.

Correlation between the relative consumption rates and relative growth rates of S. litura fed on different quantities of control diet (calibration curve) and larvae fed on diet containing different concentrations of azadirachtin.

Correlation between the relative consumption rates and relative growth rates of S. litura fed on different quantities of control diet (calibration curve) and larvae fed on diet containing different concentrations of azadirachtin.