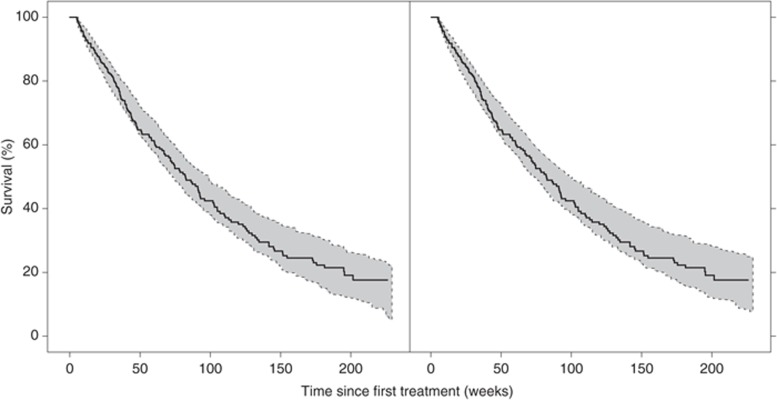
Figure 4.
Kaplan–Meier plot of the observed survival data (solid line) and the 95% confidence interval (shaded area) based on the simulated data (n = 200) for the final survival model (left). A Weibull model (λ = 0.0019, α = 1.3) was applied in the simulations to describe censoring. The right panel illustrates the predictive properties of the model when only using data from the first 6 weeks of treatment.

