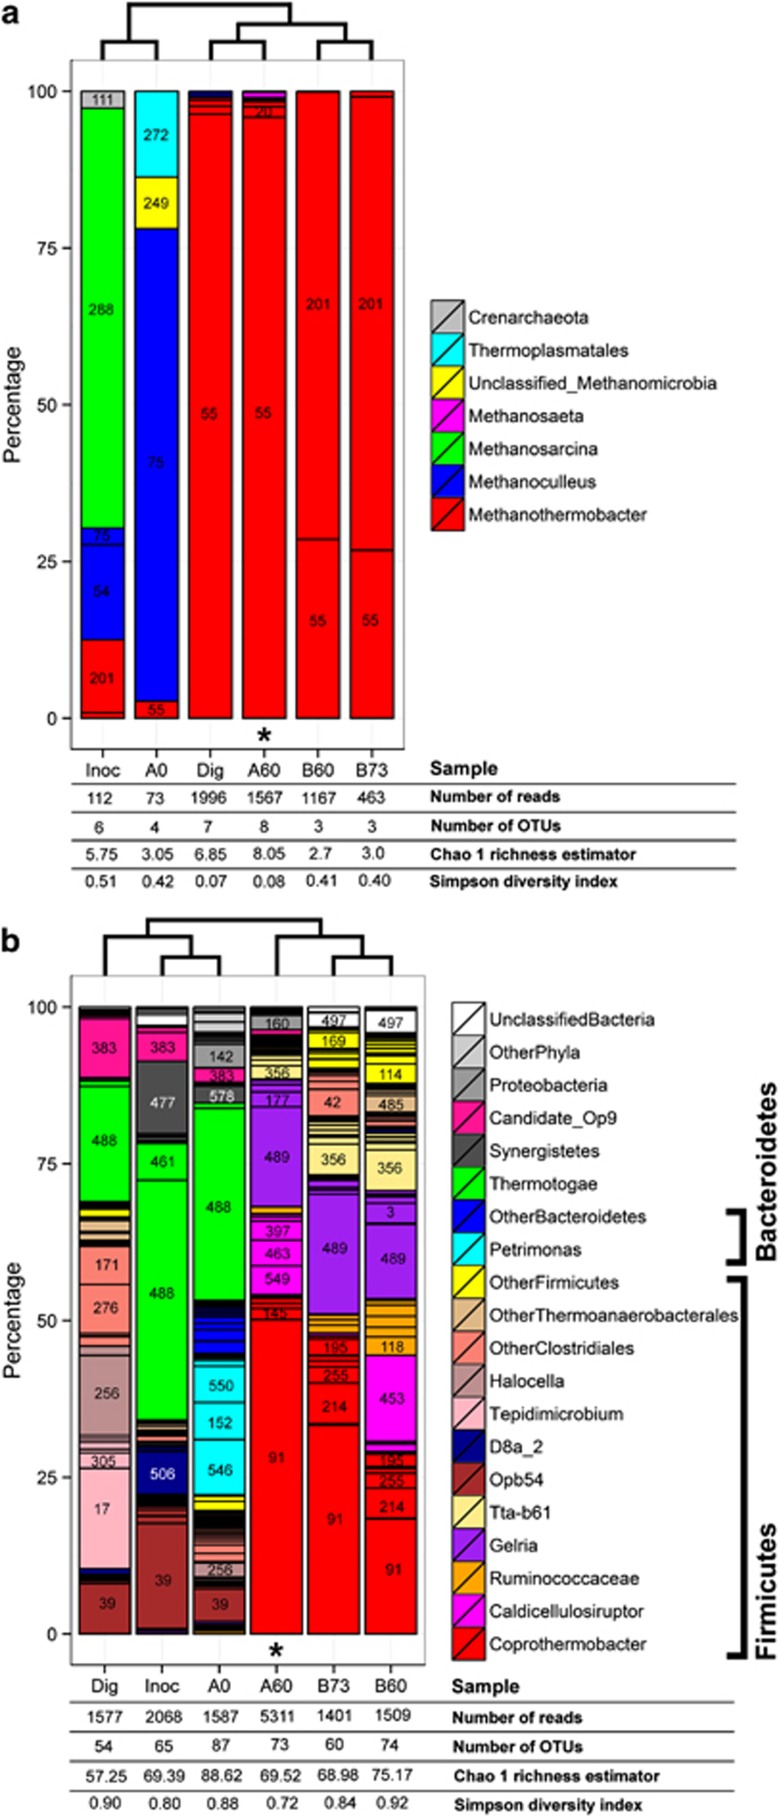
Figure 2.
Taxonomic distributions obtained by 16S rRNA gene pyrosequencing: (a) with the archaeal primer set and (b) with the bacterial primer set. Dig: collected raw thermophilic digestion sludge; Inoc: thermophilic inoculum (sieved and stabilised digestion sludge); A0, A60, B60 and B73: microcosm and incubation day; * sample also analysed by metaproteomics (A60). For the most abundant groups, the arbitrary operational taxonomic unit (OTU) number is indicated. The cladogram is based on genus frequencies for archaea (a) and on OTU frequencies for bacteria (b). See Supplementary Section S2 and Supplementary Table S1 for more details about the procedures. Rarefaction curves are shown in Supplementary Figure S13.

