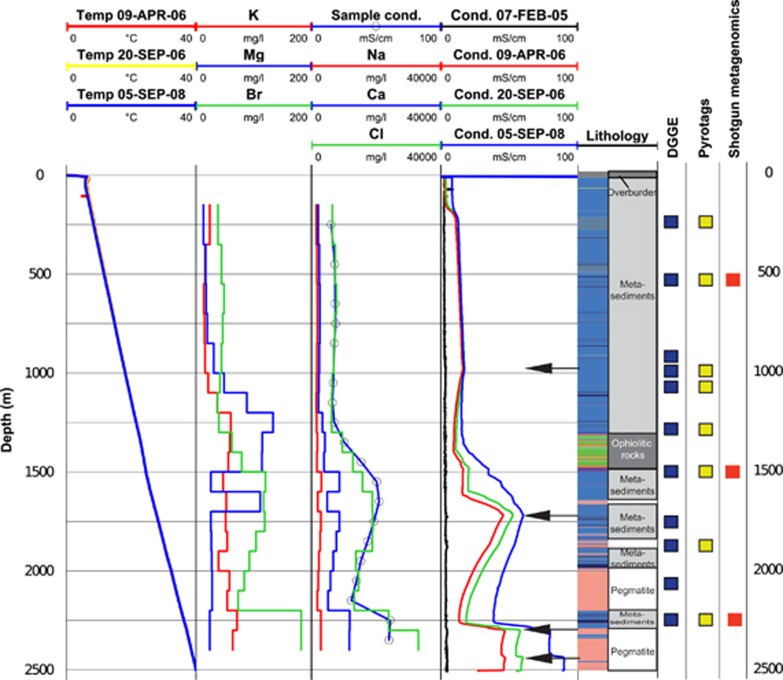
Figure 1.
The Outokumpu deep drill hole. Temperature and fluid electrical conductivity data are based on four separate post-drilling logging sessions (first and fourth column from left). Sample conductivity and chemical analyses were measured from water samples recovered in this study (second and third column from left). Lithological rock types intersected by the hole are shown in the lithology column (blue: metasedimentary mica schists; green and orange: ophiolite-derived serpentinites, skarn rock and quartz rock; pink: pegmatitic granite). The arrows indicate the most important inflow points of saline fluid to the drill hole. Analyses performed in this study are shown on the right.

