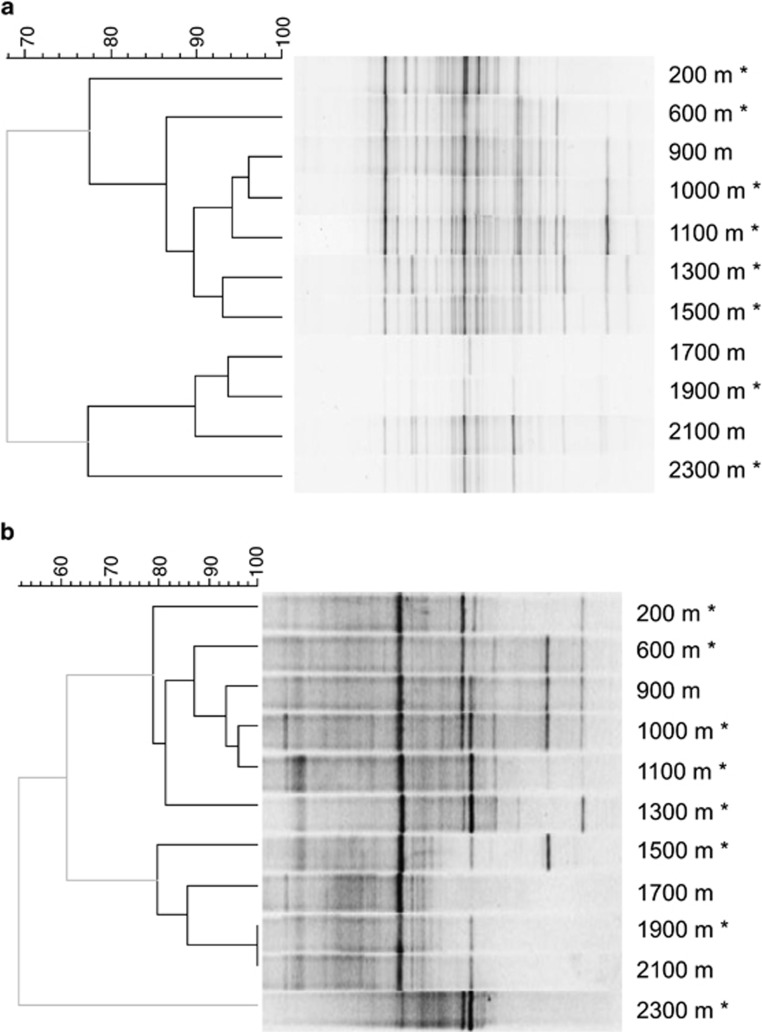
Figure 2.
Bacterial (a) and archaeal (b) community composition in the Outokumpu drill hole determined with DGGE. Similarity of DGGE profiles was calculated with the Dice's coefficient of similarity using 0.5% optimization. Clustering was performed with the UPGMA algorithm. Significant clusters (black lines) were determined by the cluster cut-off method. The scale bar represents the percentage similarity between DGGE banding patterns. Samples analyzed by 16S rRNA gene sequencing are indicated with asterisks.

