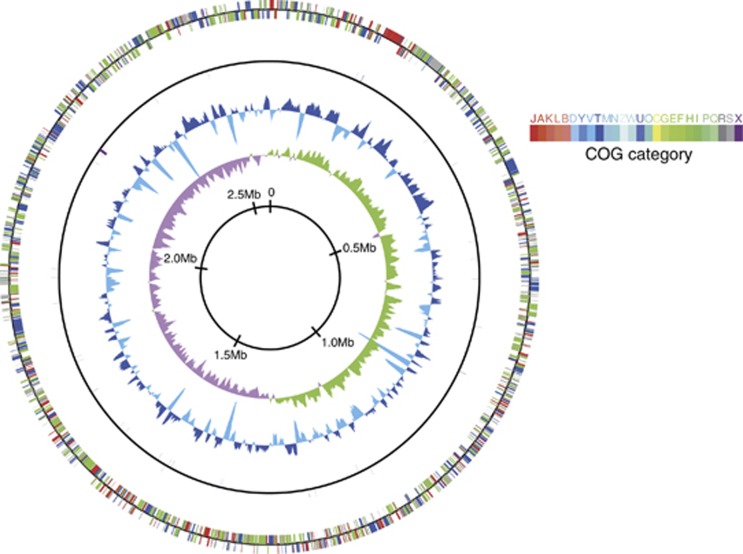
Figure 1.
Schematic circular diagram of the scaly-foot endosymbiont genome. Outer circle, predicted coding regions on the plus and minus strands, color-coded by functional categories; second circle, RNA genes on the plus and minus strands; third circle, GC content showing deviation from average (65.1%); and fourth circle, GC skew. The GC content, and GC skew were calculated using a sliding window of 5 kb in step of 2.5 kb.

