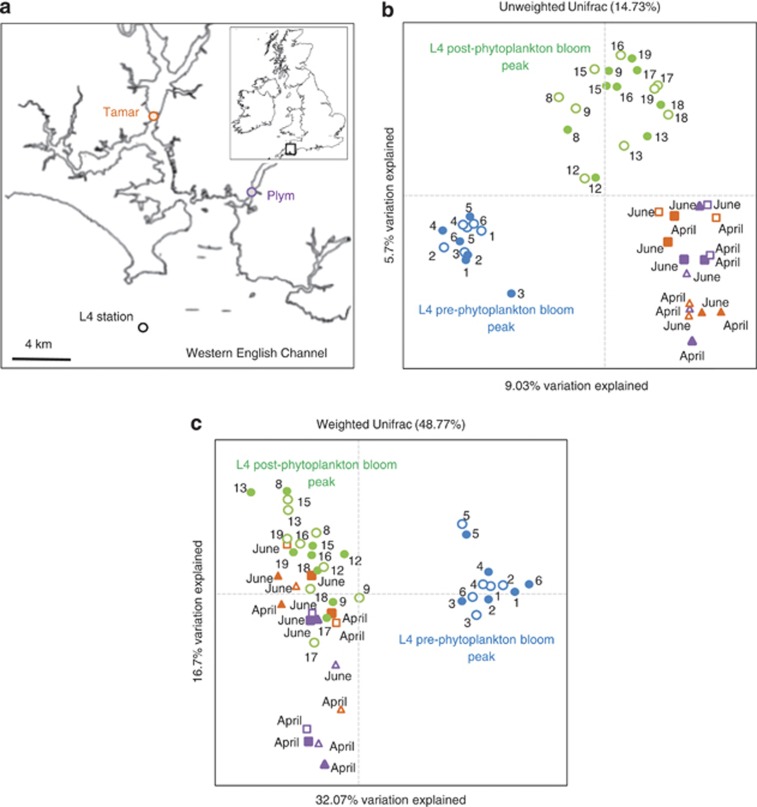
Figure 1.
(a) Location of L4 station in the Western English Channel and estuarine sampling sites on the Tamar and Plym estuaries. (b) Principal coordinates analysis plot describing betadiversity using the unweighted UniFrac distance matrix generated from OTU (97% similarity) presence/absence. Fifteen surveys were conducted over 19 weeks between 9 February and 2 July 2012 (numbers indicate week surveyed). Microlayer-enriched samples were collected using a mesh screen (sampling depth ⩽400 μm; open shapes) and underlying water samples were collected from 2 m (closed shapes). Estuarine microlayers and underlying water were sampled twice during the study period; 25 April and 27 June Tamar high tide (orange squares) and Tamar low tide (orange triangles), and 26 April and 29 June Plym high tide (purple squares) and Plym low tide (purple triangles). (c) The same analysis as b except using a weighted UniFrac distance matrix generated from OTU relative abundance.

