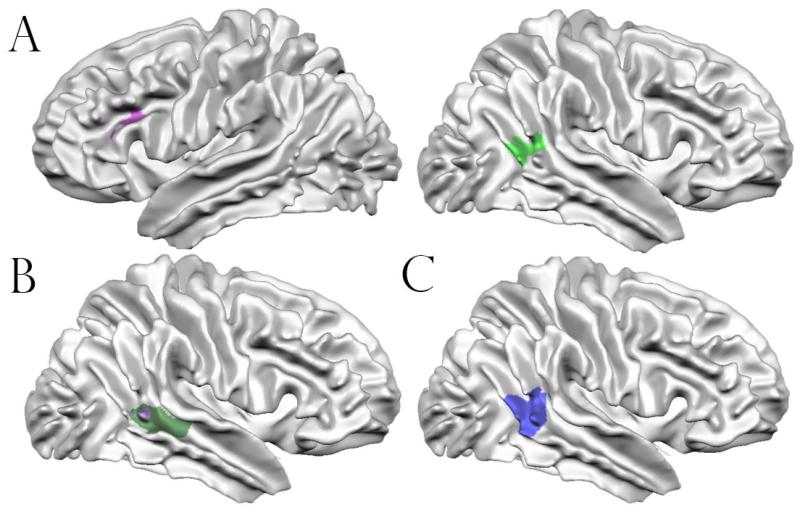
Figure 4.
Surface representations for ROIs used or created in the current study. (A): Representation of the “compensatory” right hemisphere pSTS ROI (right) and “trait” left hemisphere dlPFC (left). (B): Regions defined by a whole-brain analysis. The purple region represents the area where control children showed an incongruent > congruent effect most strongly. The green region represents the area where control children showed an incongruency preference to a significantly greater degree than unaffected siblings did. No brain regions existed where unaffected siblings responded significantly more strongly to incongruent relative to congruent trials. The green region includes areas that are occluded by the purple region. (C): Visual depiction of the pSTS region defined using activation-likelihood estimation meta-analysis.

