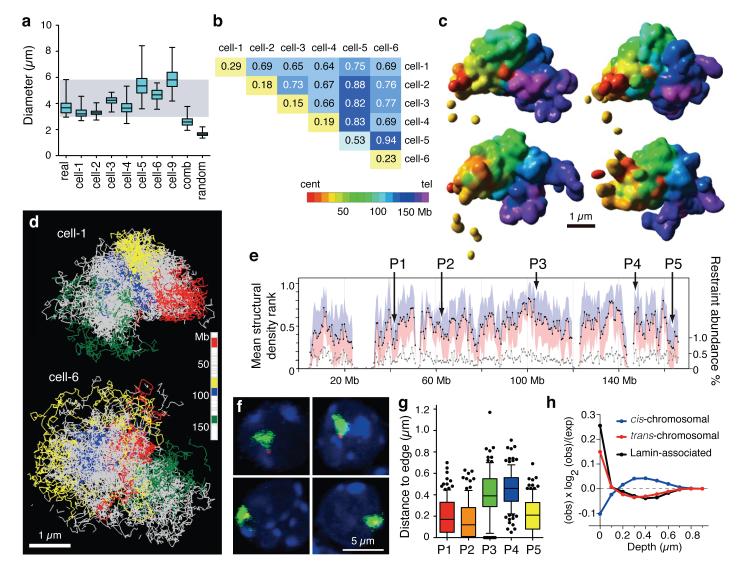
Figure 3. Structural modeling of X chromosomes.
a, Distribution of longest diameter of X chromosome paint DNA FISH signals in 62 male Th1 cells (real), 200 structural models calculated for each single cell (cell-1 to -9), 200 structures from combined dataset (cell-1 and -2; comb) and 200 structures from 20 randomised cell-1 datasets (random; 10 calculations per dataset). Whiskers denote minimum and maximum. b, Average coordinate root-mean-square deviation (RMSD) values in microns comparing 200 low-resolution structural models for each cell and between cells. c, Four surface-rendered models of the X chromosome from cell-1, which are most representative of the data based on hierarchical clustering of pair-wise RMSD values (Supplementary Information). Scale bar, 1 μm. d, Structural ensembles of the four most representative fine-scale models for cell-1 and cell-6, with four large regions coloured. Scale bar, 1 μm. e, Mean structural density rank for 500 kb regions (black) from 6 × 200 fine-scale models from cell-1 to -6. Standard deviation (blue/pink). Abundance of intra-chromosomal restraints (grey, right axis). DNA FISH probes (P1-P5) are indicated. f, DNA FISH on Th1 cells. X chromosome paint (green) and specific locus signals (red). g, Distribution of DNA FISH distance measurements between signal centres for probes P1 - P5 and edge of the X chromosome territory in Th1 cells (n = 114, 113, 105, 115, 108 for P1-P5). Whiskers denote 10 and 90 percentiles. h, Enrichment of cis-, trans-contacts and Lamin-B1 associated domains at various depths on the chromosome models relative to null hypothesis of random positions.

