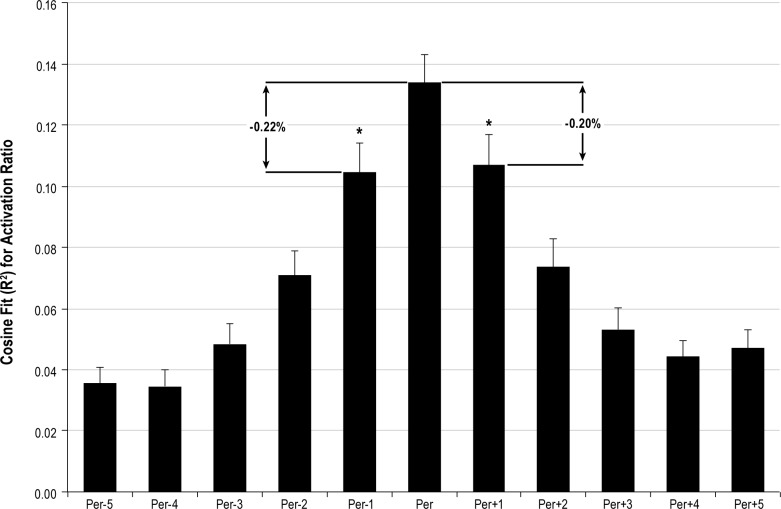
Figure 1. Sensitivity of cosine fit to activation ratio (AR) observations for all subjects and all dronabinol doses (N = 60 for best fit period).
Per represents the best fit (highest R2) period for each individual recording. On average, the Pearson correlation coefficient decreased by more than 20% when period was decreased (Per-1) or increased (Per+1) by just 6 minutes from the optimal fit. *p < 0.0005 with respect to best fit period.

