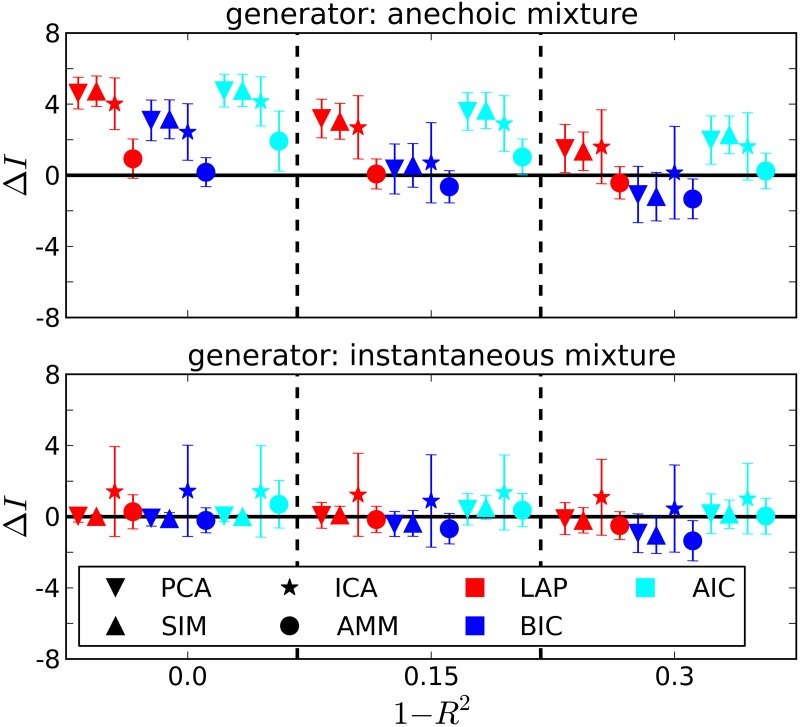
Figure 4.
Estimating the number of sources in the ground truth from J = 10 trials. ΔI =estimated-generating number of sources. 1 − R2: noise level from Equation 41. Error bars are ± one standard deviation. Symbol shapes stand for analysis algorithms, colors indicate the selection criterion. Top panel: Anechoic generator. If an AMM is used for analysis, BIC and LAP perform comparably well within the error bars, AIC tends to overestimate. For incorrect analysis models (SIM/ICA/PCA), all criteria overestimate the number of sources, since the extra variability provided by the time shifts needs to be explained via additional sources in instantaneous mixture models. Note, however, that a model type determination step based on BIC or LAP would have ruled out an instantaneous mixture with high probability (cf. Figure 3 and Table 2). Bottom panel: For the instantaneous mixture (bottom panel) all three criteria give good results when using PCA or SIM models.

