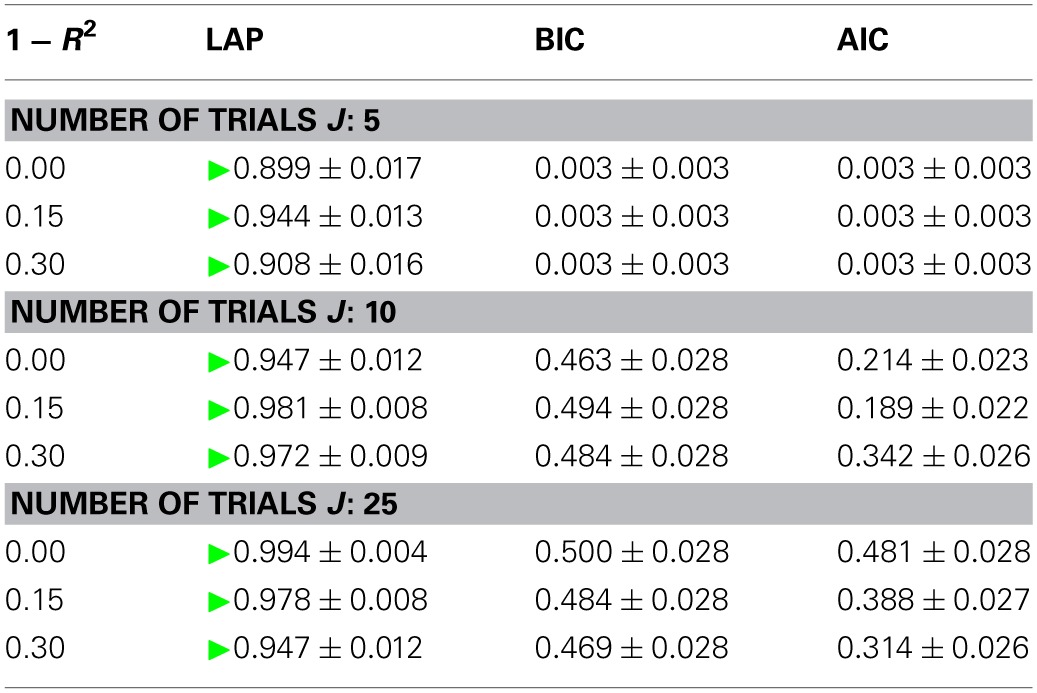
Table 1.
Model type classification rates of the three tested criteria, for number of trials between 5 (top) and 25 (bottom).

1 − R2 is the noise level from Equation 41.
![]() indicates the best criterion for each row. LAP consistently outperforms BIC and AIC, mostly because the latter two are unable to distinguish between a smooth instantaneous mixture and a pPCA model (see also Figure 3). Furthermore, for 5 trials BIC and AIC tend mistake an anechoic mixture for an ICA model, leading to model type classification rates which are virtually zero.
indicates the best criterion for each row. LAP consistently outperforms BIC and AIC, mostly because the latter two are unable to distinguish between a smooth instantaneous mixture and a pPCA model (see also Figure 3). Furthermore, for 5 trials BIC and AIC tend mistake an anechoic mixture for an ICA model, leading to model type classification rates which are virtually zero.
