
Figure 4.
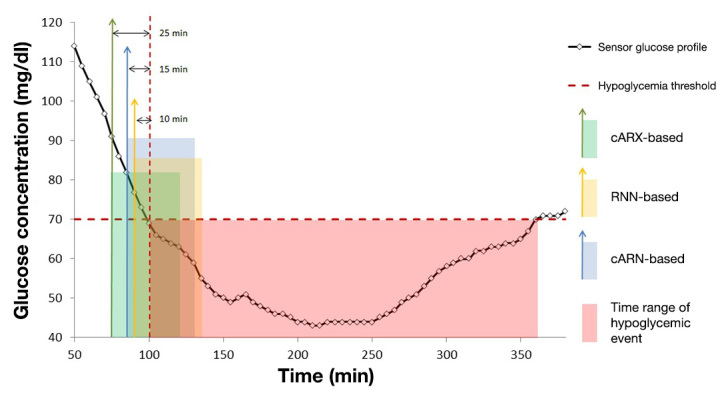
Prediction of a hypoglycemic event start and alarm generation by the system when based on cARX, RNN, and hybrid cARN models. The vertical arrows denote alarm time, and the transparent squares denote the estimated time range of event start.
Official websites use .gov
A
.gov website belongs to an official
government organization in the United States.
Secure .gov websites use HTTPS
A lock (
) or https:// means you've safely
connected to the .gov website. Share sensitive
information only on official, secure websites.
Prediction of a hypoglycemic event start and alarm generation by the system when based on cARX, RNN, and hybrid cARN models. The vertical arrows denote alarm time, and the transparent squares denote the estimated time range of event start.