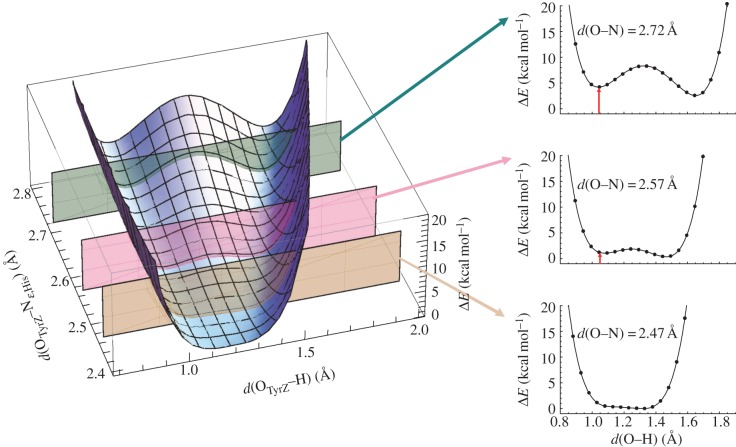
Figure 10.
Energy profiles along proton transfer coordinate the H-bond between D1-Tyr161 (TyrZ) and D1-His190 in PSII. ΔE describes the difference in energy relative to the energy minimum. The red arrow indicates the energy difference from the energy minimum, although not always shown. (Online version in colour.)

