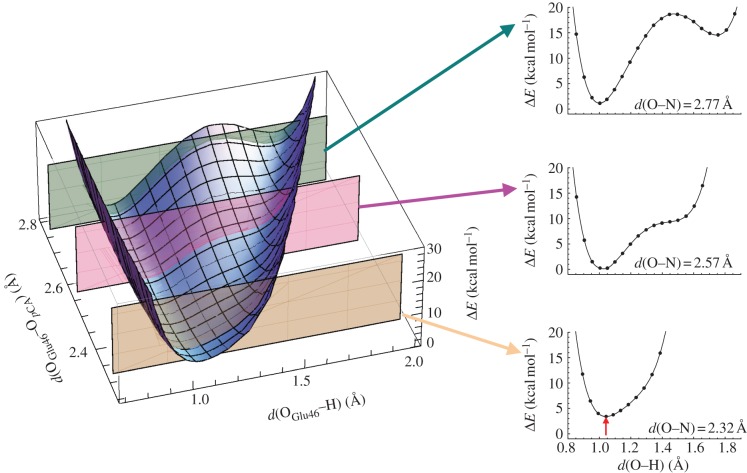
Figure 11.
Dependence of the potential energy profiles at OGlu46–OpCA = 2.32, 2.57 and 2.77 Å in PYP. The red arrow indicates the energy difference from the energy minimum obtained at OGlu46–OpCA of 2.57 Å. Compare the significantly different energetic properties of the OGlu46–OpCA bond from those of the OTyrZ–ND1-His190 bond in PSII, i.e. figure 10. In contrast to the symmetric shape of the potential energy curves irrespective of the donor–acceptor distances in PSII (figure 10), the shape of the potential energy curve never becomes symmetric in PYP, even if the distance is forced to be short. (Online version in colour.)

