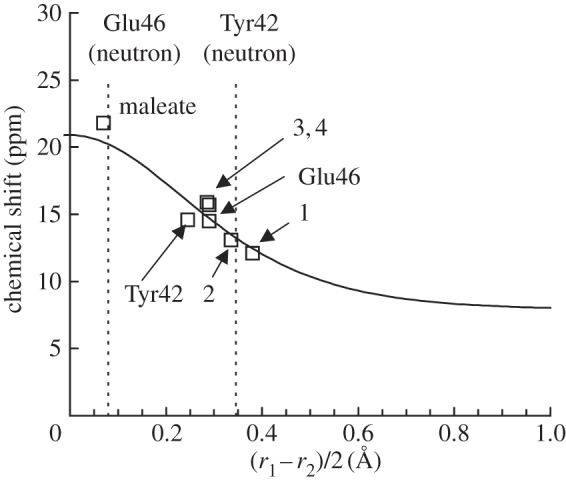
Figure 3.

Calculated δH (vertical axis) in ppm and the (Oacceptor···H)/(Odonor–H) difference (horizontal axis) in ångström. r1 = (Oacceptor···H); r2 = (Odonor–H); correlation curve (solid curve, equations (2.1) and (2.2) [36]); calculated geometry (open squares) [38]. Vertical dotted lines indicate the (r1 – r1)/2 values of OGlu46–OpCA and OTyr42–OpCA in the neutron diffraction geometry [39]. Note that only equations (2.1) and (2.2) were used to depict the correlation curve (independent of the calculated geometries).
