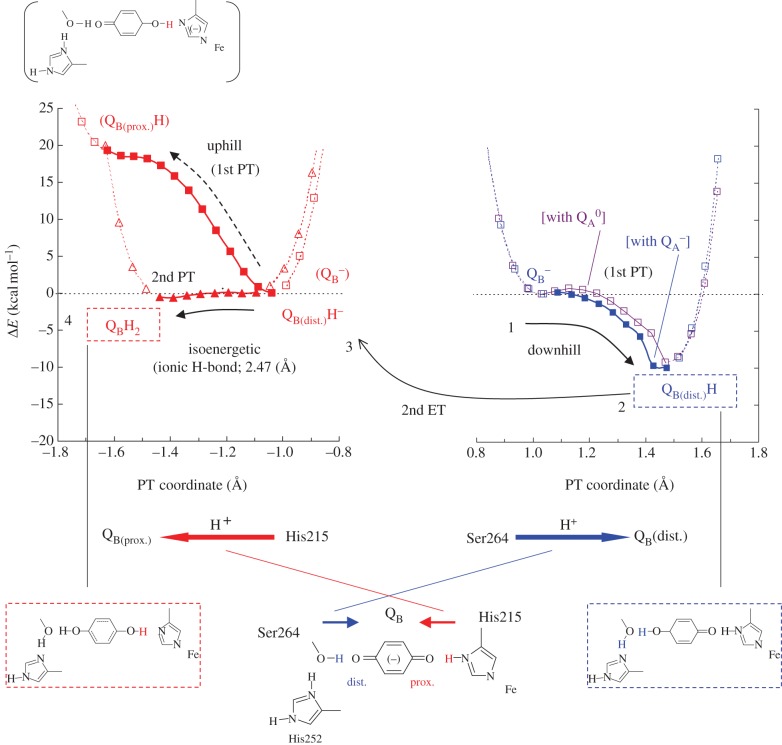
Figure 8.
Potential energy profiles of the H-bond donor–acceptor pairs in PSII: (right) H-bond between D1-Ser264 and the distal QB carbonyl (purple (in the neutral QA state) and blue (in the reduced QA state) curves); (left) H-bond between D1-His215 and the proximal QB carbonyl (red curves). Arrows indicate the directions of proton transfer. (Online version in colour.)

