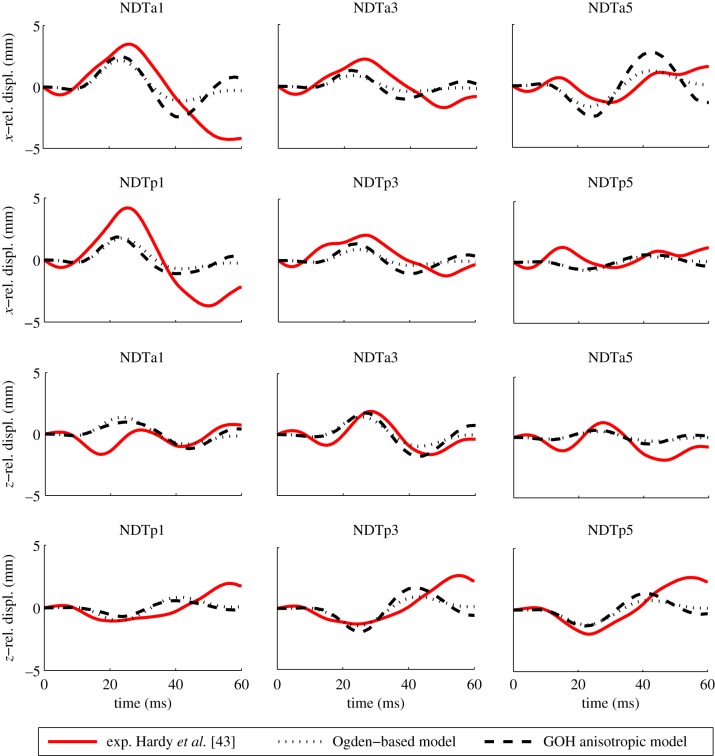
Figure 10.
Simulation of relative motion in the sagittal plane for an occipital impact (C755-T2). For marker locations and coordinate system directions, see Hardy et al. [43]. Experimental data are plotted together with the GOH anisotropic model (dashed line) and the original Ogden-based model (dotted line). (Online version in colour.)

