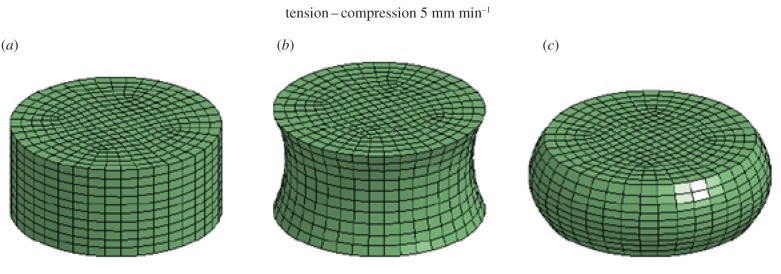
Figure 3.

Three-dimensional FE model of brain tissue samples. (a) The original configuration is shown (λ = 0). (b) A tension is applied and the new configuration of the model is illustrated at 20 s (λ = 1.3). (c) A compression is applied and the new configuration of the model is presented at 35 s (λ = 0.8). (Online version in colour.)
