
Figure 2.
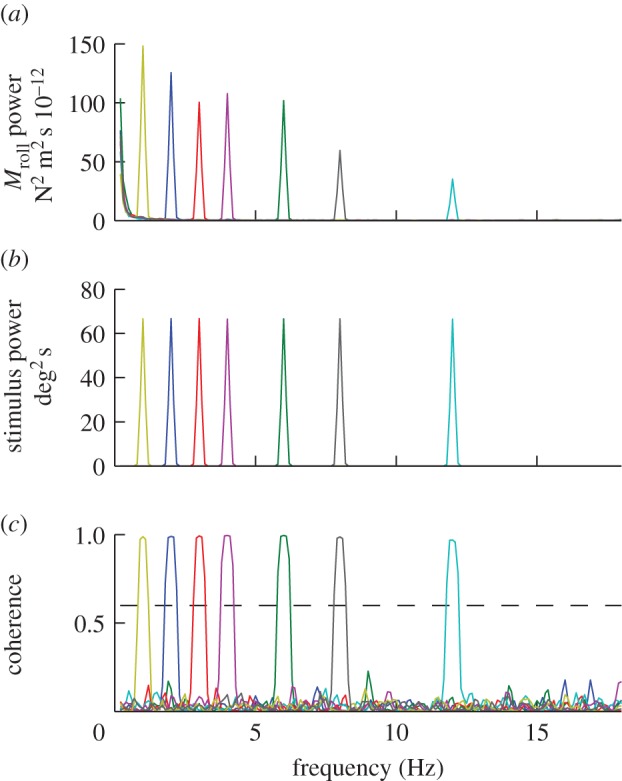
Power and coherence of the responses of a single moth to roll stimuli oscillating at different temporal frequencies. Each coloured line represents a different stimulus trial. (a) Output power spectra of the roll moments generated by the moth. (b) Input power spectra of the angular position of the visual stimulus. (c) Coherence of the roll moment response relative to the angular position of the visual stimulus.