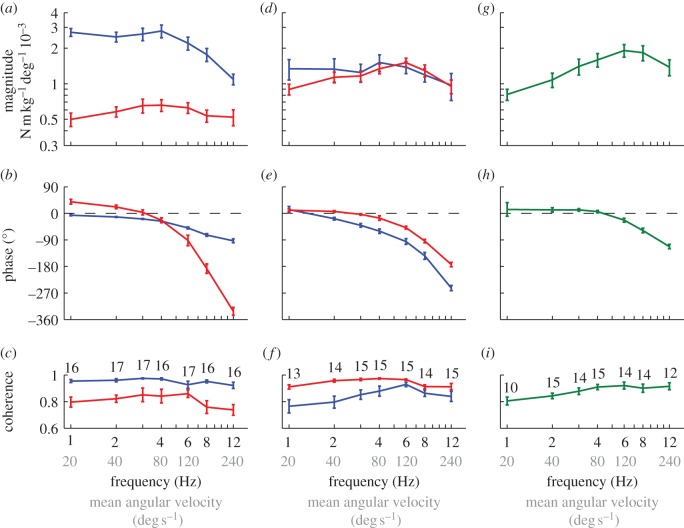
Figure 3.
Measured responses to the stimulus set varying temporal frequency. Data points show means of the individual means ± 1 s.e. Blue, roll moment; red, yaw moment; green, pitch moment. (a–c) Response to roll stimuli. (d–f) Response to yaw stimuli. (g–i) Response to pitch stimuli. (a,d,g) Magnitude of the response relative to the angular position of the stimulus. (b,e,h) Phase of the response relative to the angle of the stimulus. (c,f,i) Coherence of the response. The numbers by each point indicate the number of moths that responded to that stimulus.

