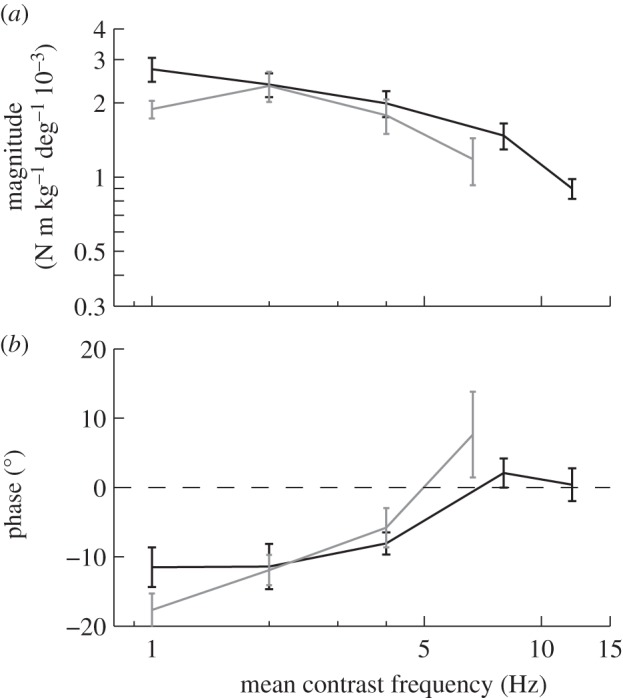
Figure 7.

Roll moment response to the stimulus sets varying spatial frequency (grey lines) and oscillation amplitude (black lines), plotted as a function of contrast frequency. Data points show means of the individual means ± 1 s.e. (a) Magnitude of the roll moment relative to the angular position of the stimulus. (b) Phase of the response relative to the angle of the stimulus.
