Figure 4.
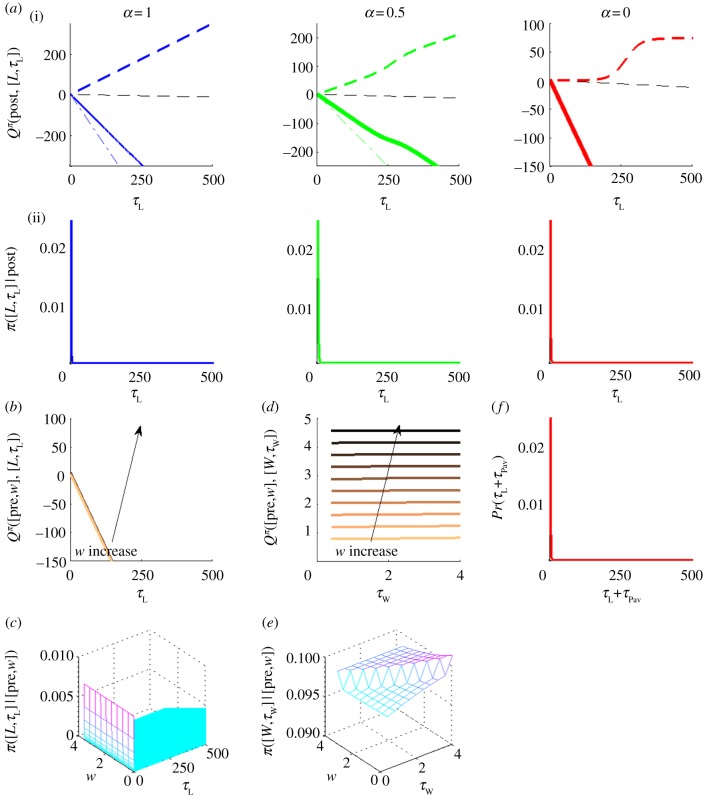
Q-values and policies for a high pay-off. ((a)(i)) and (ii) show Q-values and policies for engaging in instrumental leisure for time τL, respectively, in the post-reward state for three canonical CL(·). In (i), solid bold curves show Q-values; coloured/grey dashed and dash-dotted lines show CL(·) and the opportunity cost of time, respectively. Black dashed line is the linear component from the effective prior probability density for leisure time –λτL. Note the different y-axis scales. (b,d) Q-values and (c,e) policies for (b,c) engaging in leisure for time τL and (d,e) working for time τW in a pre-reward state [pre, w]. Light to dark colours shows increasing w, i.e. subject is furthest away from the price for light, and nearest to it for dark. (f) Probability of engaging in leisure for net time τL+τPav in the post-reward state for sigmoid CL(·) (α = 0). This is the same as the right in ((a)(ii)) but shifted by τPav, RI = 4.96, price P = 4s. (Online version in colour.)

