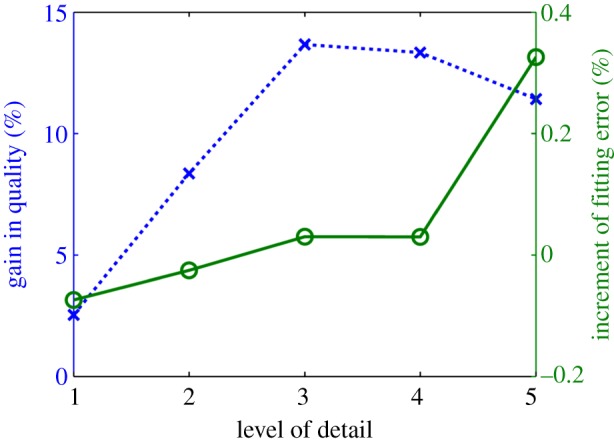
Figure 8.

Impact of the mesh enhancement in the meshing pipeline (step 4 in figure 1) for each LoD. Values represent the mean results in the two average anatomies (A1, A2), quality in dashed line, and fitting error in solid line. (Online version in colour.)
